How to Draw Shear Force and Bending Moment Diagrams: Simply Supported Beam
To draw shear force and bending moment diagrams (SFD and BMD), find the support reactions, then work along the beam from left to right and plot the internal shear force V and bending moment M directly under it. The maximum bending moment occurs where the shear crosses zero. For a simply supported beam of span L, a point load P at midspan gives reactions of P/2 and a maximum moment of PL/4; a uniform load w gives reactions of wL/2 and a maximum moment of wL²/8, both at midspan.
Step by step: how to draw the SFD and BMD
The method suits any statically determinate beam. Both examples use a 6 m simply supported beam, pinned at the left and on a roller at the right.
- Draw a free-body diagram and find the reactions from ΣFy = 0 and ΣM = 0. A distributed load may be replaced by its resultant for this step only.
- Mark the key points: supports, point loads, applied couples, and the ends of every distributed load. Between key points, each diagram follows one formula.
- Plot the shear from left to right, starting at V = 0. An upward force makes V jump up, a downward force makes it jump down, and a distributed load changes V by the area under the load.
- Find where V = 0. These are the candidates for the largest moment.
- Plot the moment, starting at M = 0 at the pinned end. The change in M between two points equals the area under the shear diagram between them.
- Check that both diagrams close: V returns to zero at the right support, and so does M.
Sign convention: choose one and keep it
Internal forces act in equal and opposite pairs on the two faces of a cut, so “up” alone cannot define a sign. This article uses the common textbook convention for V and M, as in the open textbook Engineering Statics: Open and Interactive, and counts downward loads as positive:
| Quantity | Positive when | Plotted |
|---|---|---|
| Shear force V | It acts downward on the cut face of the left-hand piece (and upward on the right-hand piece) | Above the axis |
| Bending moment M | It bends the beam concave up (sagging): top fibers in compression, bottom in tension | Above the axis |
| Distributed load w | It acts downward | On the beam sketch |
With these choices, dV/dx = −w and dM/dx = V. Books that count upward loads as positive write dV/dx = w; the diagrams are the same. Some structural courses, such as TU Delft’s, draw the moment on the tension side of the member, so a sagging moment appears below the axis. Whichever you use, never mix conventions within one problem.
Example 1: central point load (Mmax = PL/4)
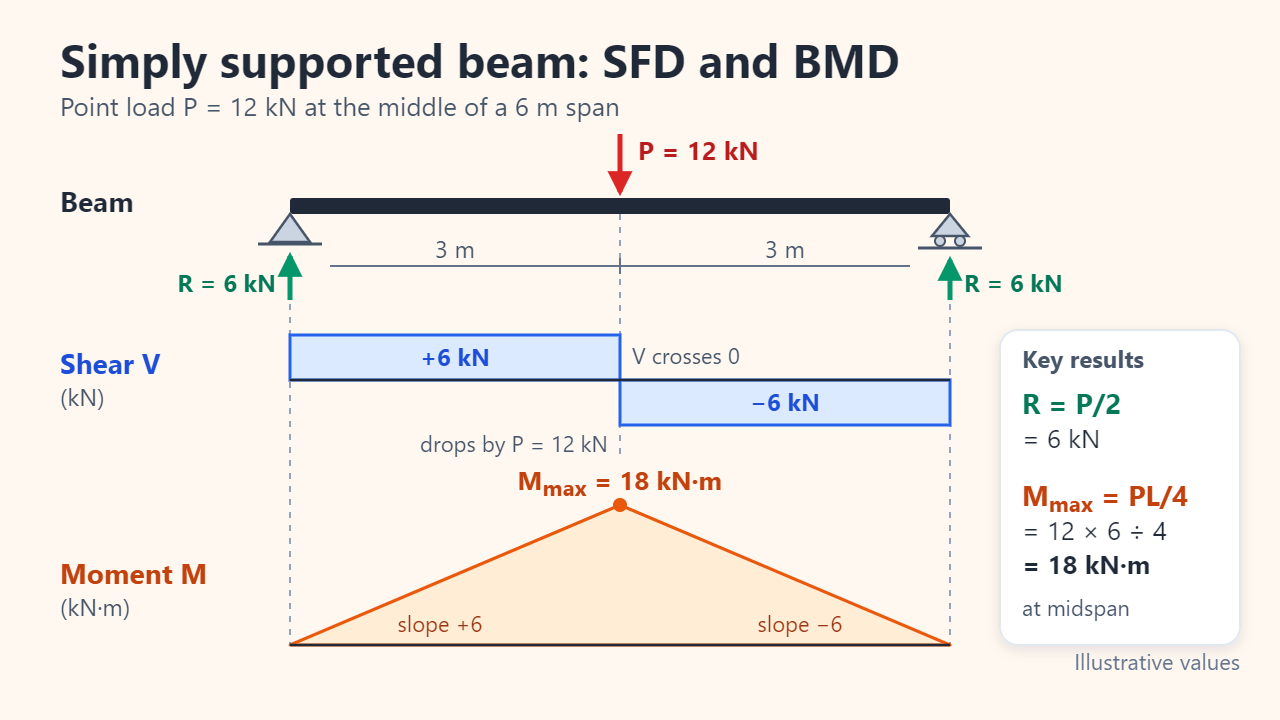
Take P = 12 kN at midspan (illustrative numbers). Moments about the left support give RB × 6 = 12 × 3, so RB = 6 kN, and vertical equilibrium leaves RA = 6 kN. Each reaction is P/2.
Shear: V jumps to +6 kN at the left support and stays constant across the unloaded left half. At midspan the 12 kN load drops it to −6 kN, and the right reaction returns it to zero. The SFD is two rectangles.
Moment: for 0 ≤ x ≤ 3 m, M = 6x (kN·m), a straight line whose slope equals the shear, +6. It peaks at x = 3 m: Mmax = 6 × 3 = 18 kN·m, which is PL/4 = 12 × 6 ÷ 4. The positive shear rectangle has the same area, 6 × 3 = 18. The right half falls back to zero with slope −6, so the BMD is a triangle.
Example 2: uniform load (Mmax = wL²/8)
Now spread w = 4 kN/m over the same 6 m span, 24 kN in total. Each reaction is wL/2 = 12 kN.
Shear: V = 12 − 4x. It starts at +12 kN, falls in a straight line with slope −w = −4 kN/m, crosses zero at x = 3 m and reaches −12 kN at the right support.
Moment: M = 12x − 2x², a parabola. At x = 3 m, Mmax = 36 − 18 = 18 kN·m, matching wL²/8 = 4 × 36 ÷ 8 and the area of the positive shear triangle, ½ × 12 × 3. At the quarter points (x = 1.5 m and 4.5 m), M = 13.5 kN·m, three quarters of the peak.
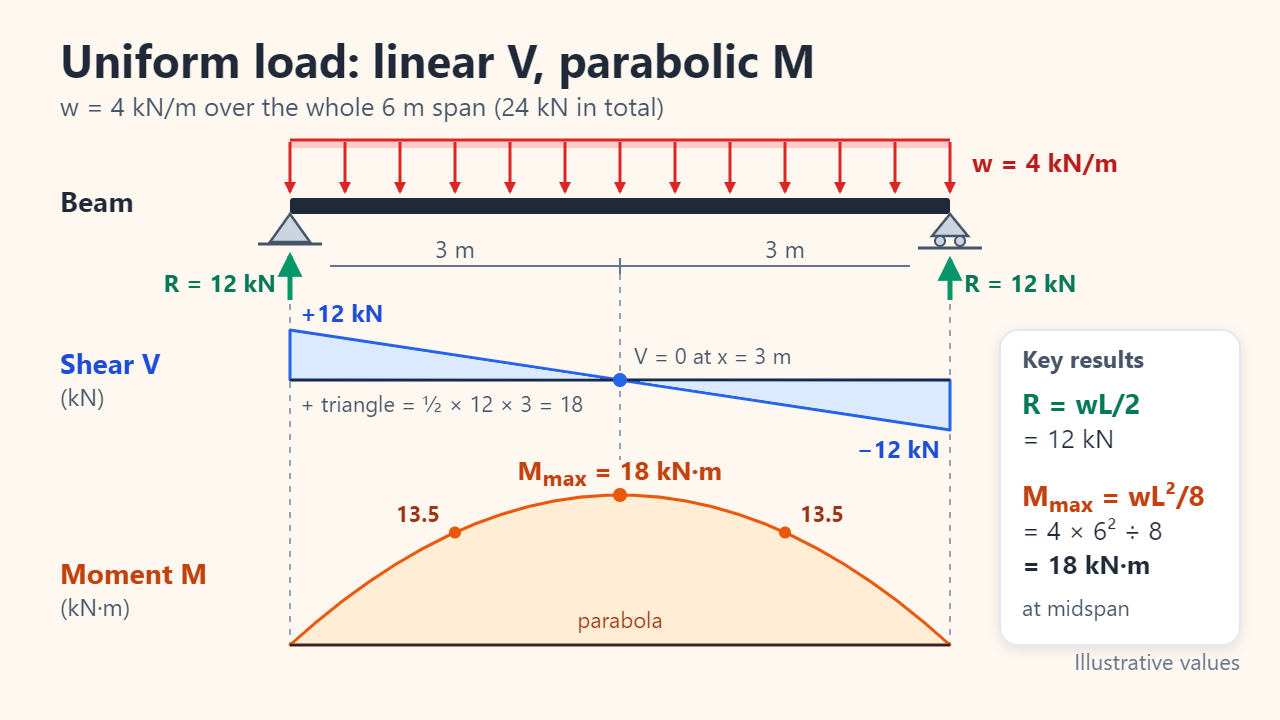
The uniform load is twice the total of Example 1 yet gives the same peak: a load W spread evenly produces WL/8, half the WL/4 of the same W at midspan. Both results match the American Wood Council’s beam tables.
| Central point load P | Uniform load w | |
|---|---|---|
| Reactions | P/2 each | wL/2 each |
| SFD shape | Two rectangles, +P/2 and −P/2 | Straight line from +wL/2 to −wL/2 |
| BMD shape | Triangle | Parabola |
| Maximum moment | PL/4 at midspan | wL²/8 at midspan |
| Example, L = 6 m | P = 12 kN → 18 kN·m | w = 4 kN/m → 18 kN·m |
Load, shear and moment relationships
Two relations explain every shape. With downward loads positive, dV/dx = −w(x): the slope of the shear diagram is minus the load intensity. And dM/dx = V(x): the slope of the moment diagram equals the shear. Integrated, the change in V between two points is minus the load area, and the change in M is the shear area.
Each integration raises the polynomial degree by one. No load gives constant V and linear M; a uniform load gives linear V and parabolic M; a linearly varying (triangular) load gives parabolic V and cubic M. Concentrated actions differ: a point force makes V jump by its magnitude and leaves a kink in M, while an applied couple leaves V unchanged and makes M jump, upward for a clockwise couple when reading left to right.
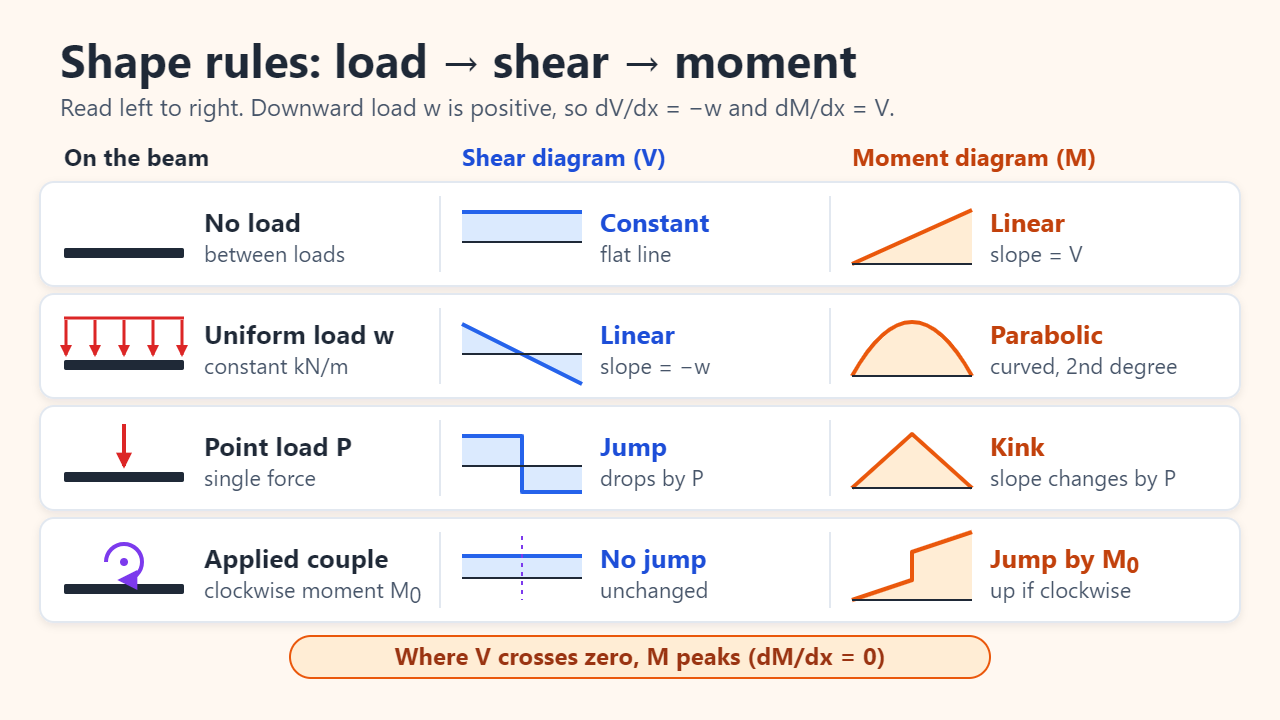
Because dM/dx = V, M has a local maximum or minimum wherever V crosses zero, including a jump through zero as in Example 1. Also check beam ends and moment jumps: a cantilever’s largest moment is at its fixed support, where V is not zero.
Checking your diagrams: common mistakes
- Switching sign conventions mid-problem, for example between the section equations and the plot, which flips signs in V or M.
- Missing the jump at a point load. The SFD must be vertical there; a sloped line means the load was treated as distributed.
- Drawing the uniform-load BMD as a triangle. Under a distributed load, M is curved, with a flat top (zero slope) where V = 0.
- Diagrams that do not close. If V or M is not zero at the right support, recheck the reactions first.
FAQ
Why is the maximum bending moment where the shear force is zero?
Because shear is the slope of the moment diagram (dM/dx = V). Where V changes sign, M stops rising and starts falling, so it peaks there.
What if the point load is not at midspan?
For a load P at distance a from the left support and b from the right, the reactions are Pb/L (left) and Pa/L (right), and Mmax = Pab/L under the load. With P = 12 kN, a = 2 m and b = 4 m (illustrative numbers), the reactions are 8 kN and 4 kN and Mmax = 16 kN·m. Setting a = b = L/2 gives back PL/4.
Do the material and cross-section change the SFD and BMD?
Not for a statically determinate beam such as a simply supported one: V and M follow from equilibrium alone. Section and material matter in the next step, when M is converted into bending stress or deflection.
Sources: American Wood Council: Beam Design Formulas (Design Aid No. 6); Engineering Statics: Load, shear and moment relations; Engineering Statics: Graphical method; TU Delft OpenCourseWare: Deformation signs.
Related reading
Original illustrations created to help explain this article.