How to Read a Camera Histogram: Spot Clipping, Over- and Underexposure
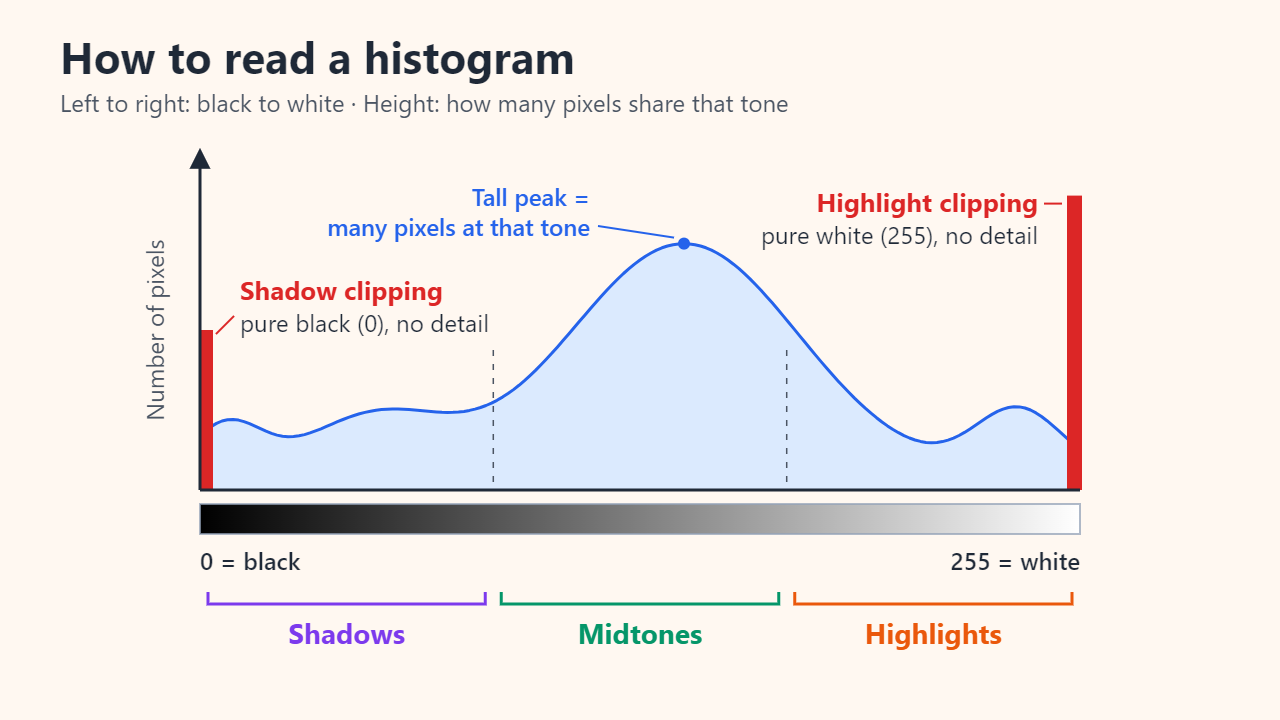
A camera histogram is a graph of brightness: the horizontal axis runs from pure black on the left to pure white on the right, and the height at each point shows how many pixels have that brightness. To judge exposure, look at the two edges first. Data piled against the right wall means blown highlights, and data piled against the left wall means crushed shadows. Where the bulk of the graph sits between the edges depends on the scene, so there is no single correct shape.
What the two axes mean
The camera builds its histogram from an 8-bit image, so the horizontal axis holds 256 tonal levels, numbered 0 (black) to 255 (white). The left third is loosely called the shadows, the middle the midtones and the right third the highlights. These are handy labels, not hard boundaries.
The vertical axis counts pixels. Cameras print no numbers on it and scale the graph to fit the screen, so height only means something relative to the rest of the same histogram. A 24-megapixel photo sorts roughly 24 million pixels into those 256 columns; a tall peak simply means many of them share similar tones. Two things the histogram cannot tell you are where in the frame those pixels sit and whether the picture looks good.
Typical shapes, and why none is “correct”
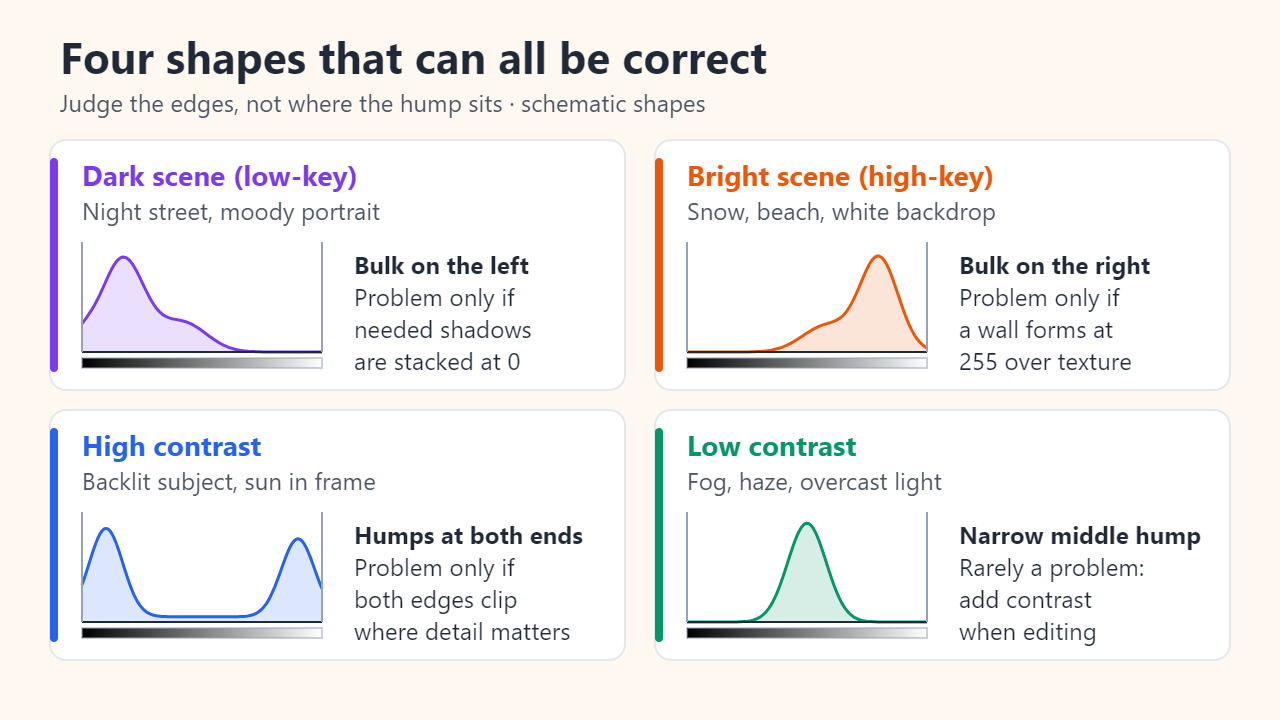
A popular myth says a good histogram is a bell curve centered in the middle. In reality the shape follows the subject. A black cat on a dark sofa should lean left; a skier on fresh snow should lean right. Auto exposure tends to pull the average toward the midtones, which is why snow often comes out gray and night scenes look washed out unless you apply exposure compensation.
| Scene | Typical histogram | A real problem only if… |
|---|---|---|
| Dark (low-key): night street, moody portrait | Bulk on the left, little on the right | Shadow detail you need is stacked against 0 |
| Bright (high-key): snow, beach, white backdrop | Bulk on the right, little on the left | A wall forms at 255 over textured areas |
| High contrast: backlit subject, sun in frame | Humps at both ends, thin middle | Both edges clip where detail matters |
| Low contrast: fog, haze, overcast light | Narrow hump in the middle, gaps at both ends | Rarely; contrast can be added when editing |
Clipping: the walls at the edges
Clipping happens when the scene is brighter or darker than the image can record. Everything above the ceiling is stored as 255 and everything below the floor as 0, and the texture in those areas is gone. On the graph this shows up as a wall: the data runs straight into the edge, often as a tall spike, instead of tapering off before it.
Not every wall needs fixing. Ask three questions:
- What is clipped? Turn on the highlight alert, the “blinkies” that flash overexposed areas during playback. A bare bulb, the sun or a glint on chrome can stay white; a wedding dress or the texture in clouds should not.
- How much? A thin sliver at the edge is a handful of pixels; a towering wall is a large area.
- Which edge? Pixels at exactly 255 or 0 hold no detail in a JPEG. Shadows sitting just above 0 can often be brightened in editing, at the cost of more visible noise.
Brightness vs RGB histogram: one channel can clip unseen
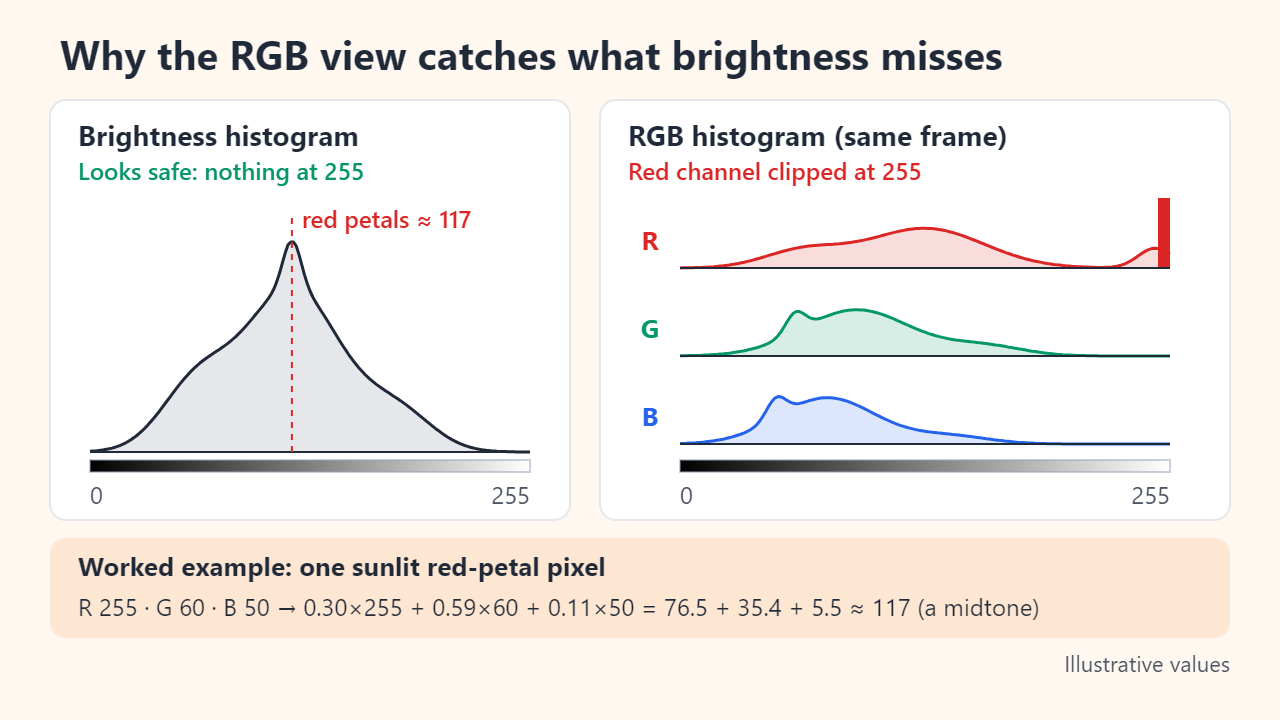
Many cameras offer two displays. The brightness (luminance) histogram turns each pixel's red, green and blue values into one number; the RGB histogram shows the three channels separately. Canon's support guide describes the brightness view as a way to check exposure and the RGB view as a way to check color saturation, and the difference matters with vivid subjects.
A common luminance formula weights green most and blue least, roughly 30% red, 59% green and 11% blue. Take a sunlit red petal with the illustrative values R 255, G 60, B 50: 0.30 × 255 + 0.59 × 60 + 0.11 × 50 = 76.5 + 35.4 + 5.5, or about 117. The brightness histogram places that pixel at a comfortable midtone, yet the red channel has already hit its 255 ceiling, so the petal can turn into a flat patch of red without texture. Because blue carries the smallest weight, blue clipping in stage lights or a deep evening sky is the hardest to spot without the RGB view.
Your camera's histogram comes from the JPEG preview
Even if you shoot raw only, the camera renders a JPEG preview for its screen using the current white balance, picture style, contrast and tone curve, and the histogram and highlight alert are calculated from that preview rather than from the raw data. Tests published by the developers of FastRawViewer show that switching picture style, white balance or contrast moves the histogram even though the raw data is identical. Nikon's Z9 manual likewise cautions that camera histograms “may differ from those displayed in imaging applications.”
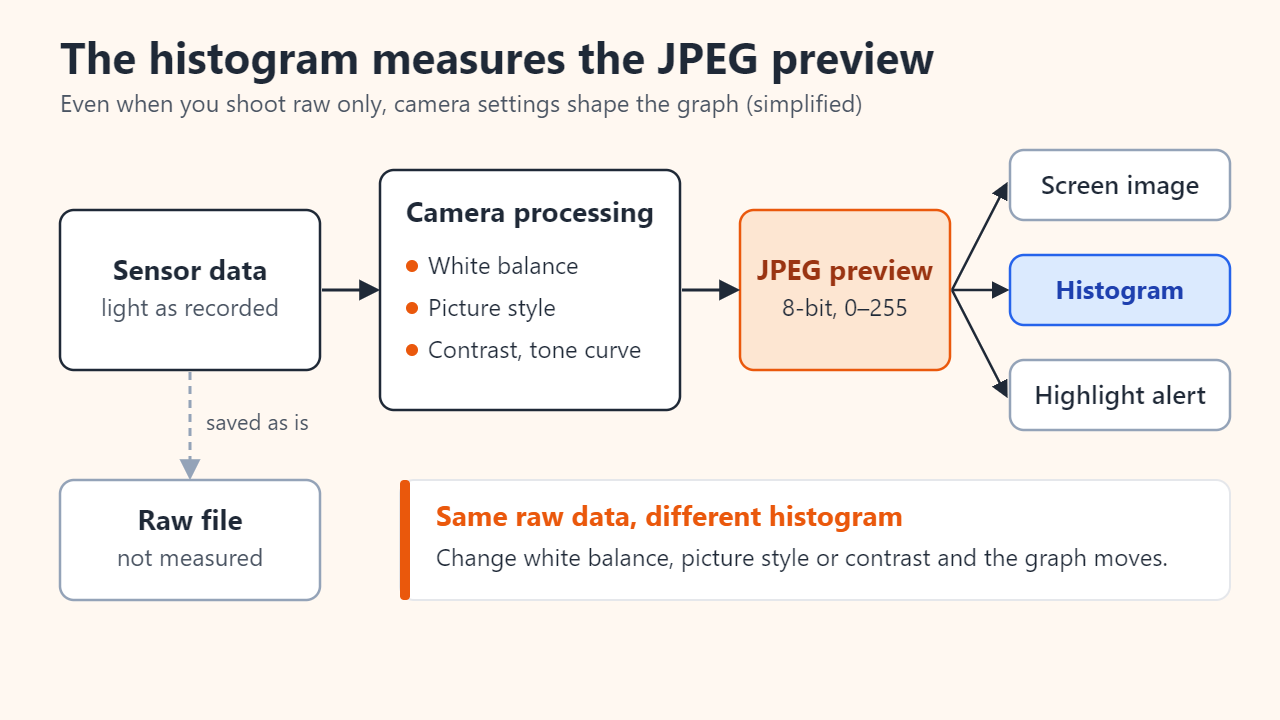
Three practical consequences follow. A raw file often has some highlight headroom beyond what the histogram shows; in one FastRawViewer test the graph touched the right wall while the raw data still had slightly more than half a stop to spare. Editing software may draw a different graph from the same file. And a neutral or low-contrast picture style brings the in-camera histogram closer to the raw data, though never exactly. If you shoot JPEG, the histogram describes your final file far more faithfully.
Using the histogram in the field
Exposure compensation is the quickest control: raising it shifts the graph to the right and lowering it shifts it to the left. One stop doubles or halves the light, but the graph does not slide by a fixed number of levels per stop, because the tone curve squeezes the deep shadows and brightest highlights into narrow bands near the edges.
- Show the histogram live on the screen or in the viewfinder, or on the playback screen after each shot, and choose the RGB view if your camera has one.
- Check the right edge first. If a wall sits on something that needs detail, lower exposure compensation by 1/3 to 1 stop and look again.
- Then check the left edge. If important shadows are crushed and there is still room on the right, raise compensation in 1/3-stop steps.
- If both edges clip, the scene has more contrast than one exposure can hold. Decide what matters most, add fill light or a reflector, or bracket several exposures.
- In manual mode, make the same moves with shutter speed, aperture or ISO.
FAQ
Should my histogram be a bell curve in the middle?
No. A centered hump suits average scenes only. Snow should lean right and night scenes left; what deserves your attention is the two edges.
Why does the histogram in my editing software look different?
The camera measured its own JPEG preview, built with its picture style and white balance, while the editor renders the raw data its own way. Different rendering, different graph.
Can I recover clipped highlights later?
Not from a JPEG: pixels stored at 255 carry no detail. A raw file may still hold data in areas the camera flagged, thanks to the headroom described above, but once the raw data itself is clipped, the original detail is gone and software can only estimate it.
Sources: Canon support: How do I read a histogram?; Nikon Z9 online manual: histogram and highlight display; Cambridge in Colour: Camera Histograms, Luminance & Color; FastRawViewer: Can you evaluate exposure using the in-camera histogram?
Related reading
Original illustrations created to help explain this article.