When the overall success rate reverses: a practical Simpson's paradox example
This article was translated from its source language with AI assistance. Please check technical terms and equations against the original.
Method B performs better on both easy and hard tasks. Can method A still have the higher overall success rate? Yes, if they attempted different mixtures of tasks. Understanding that reversal helps you inspect what a dashboard's pooled percentage combines before using it to rank performance.
Calculate an invented example
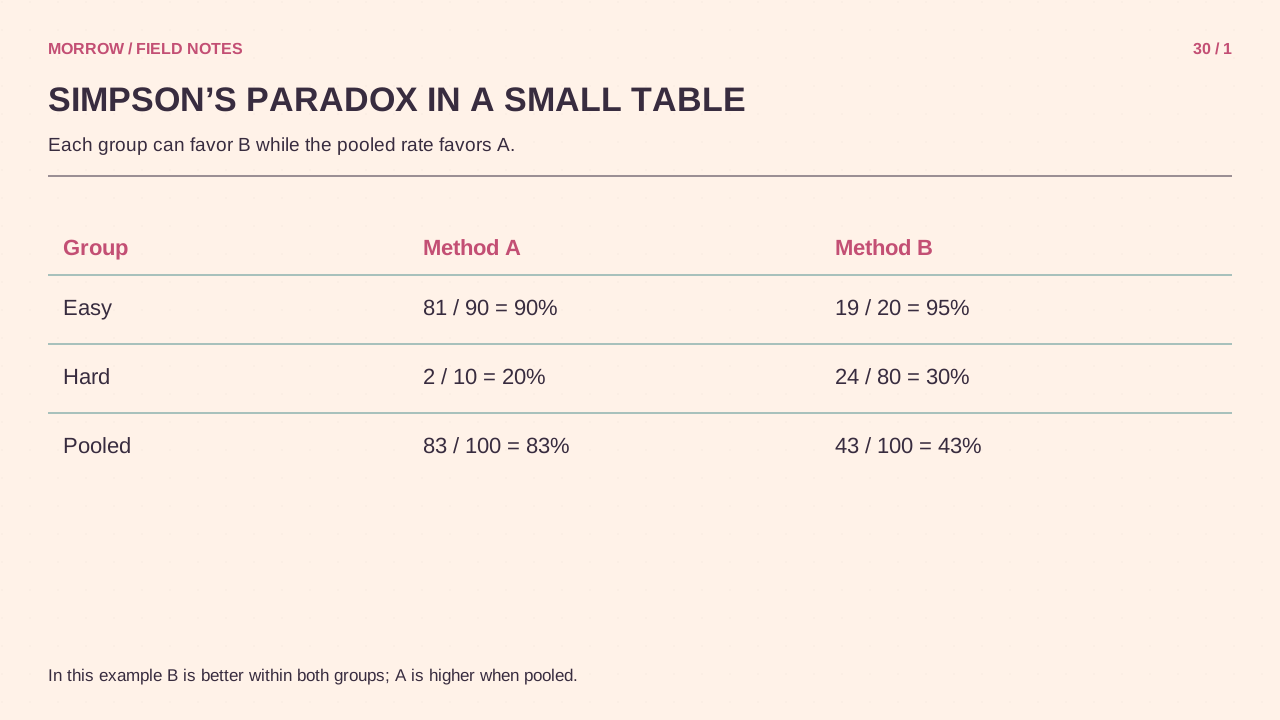
These numbers are educational, not results from a real product or trial. Method A attempts mostly easy tasks, while B attempts mostly hard ones.
| Task | A successes/attempts | A rate | B successes/attempts | B rate |
|---|---|---|---|---|
| Easy | 81/90 | 90% | 19/20 | 95% |
| Hard | 2/10 | 20% | 24/80 | 30% |
| All | 83/100 | 83% | 43/100 | 43% |
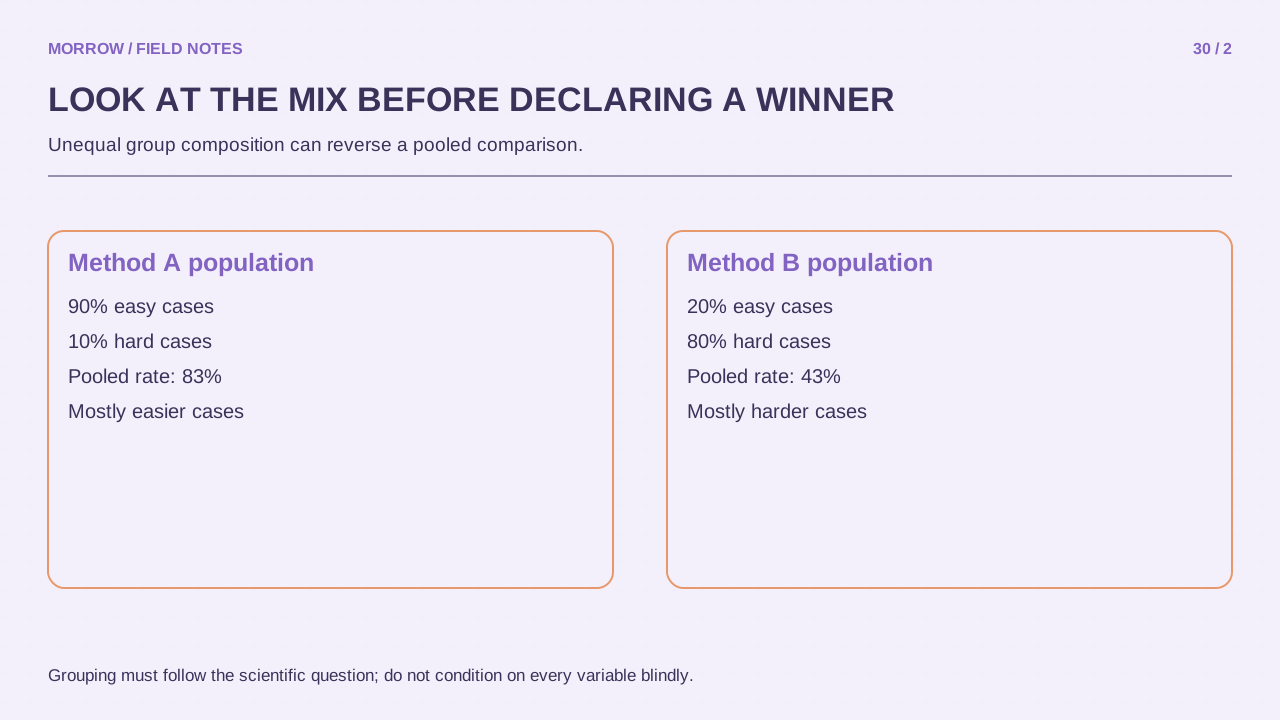
B exceeds A on easy tasks, 95% versus 90%, and on hard tasks, 30% versus 20%. Yet easy tasks account for 90% of A's attempts and only 20% of B's. Their pooled rates, 83% and 43%, reflect those different mixtures. The totals were not calculated incorrectly.
The hidden weights differ
A's pooled rate is 0.9 × 90% + 0.1 × 20% = 83%. B's is 0.2 × 95% + 0.8 × 30% = 43%. Because the group rates receive different weights, the ordering within groups need not survive pooling. Simpson's original 1951 paper addresses interpretation in contingency tables. The BMJ discussion of confounding and Simpson's paradox illustrates reversal involving a third factor.
The observed overall rate answers, “How successful were all the tasks actually attempted?” Group comparisons answer, “Which rate was higher within the same task type?” Those are different questions. Decide which question matters before treating the answers as a contradiction.
Compare a shared mixture explicitly
For illustration, assign easy and hard tasks equal shares of 50%. A then has (90% + 20%) divided by two, or 55%, while B has (95% + 30%) divided by two, or 62.5%. These are standardized comparisons for a hypothetical shared mixture, not the original observed totals. In a real decision, an arbitrary 50% share is not automatically appropriate; justify weights using the target population or intended task mix.
Grouping does not automatically reveal the truth
The right grouping depends on your question and how the data were generated. Conditioning on a variable measured after an outcome or affected by selection can introduce another bias. This table alone cannot establish that B is causally better under every condition. Assignment methods, timing, population differences and unmeasured factors may matter.
- Inspect numerators and denominators alongside the pooled rate.
- Check differences in relevant pre-existing conditions.
- Show subgroup tables and their sample sizes.
- Explain weights if comparing a shared mixture.
- Separate observed associations from cause-and-effect claims.
The lesson is not to discard the overall number. Read the conditions it has combined. Once you know that “A overall, B within each group” is possible, you can ask for the comparison question and its denominators before accepting a quick ranking.
Related practical guides
Original illustrations created to help explain this article.