How to read a logarithmic chart: equal distances mean equal ratios
This article was translated from its source language with AI assistance. Please check technical terms and equations against the original.
When an axis runs through 1, 10, 100 and 1,000 at equal intervals, those intervals represent equal ratios rather than equal additions. A logarithmic axis can reveal smaller values across a wide range, but reading it like an ordinary ruler can mislead you about growth. Check the tick labels and any “log” label before interpreting the shape.
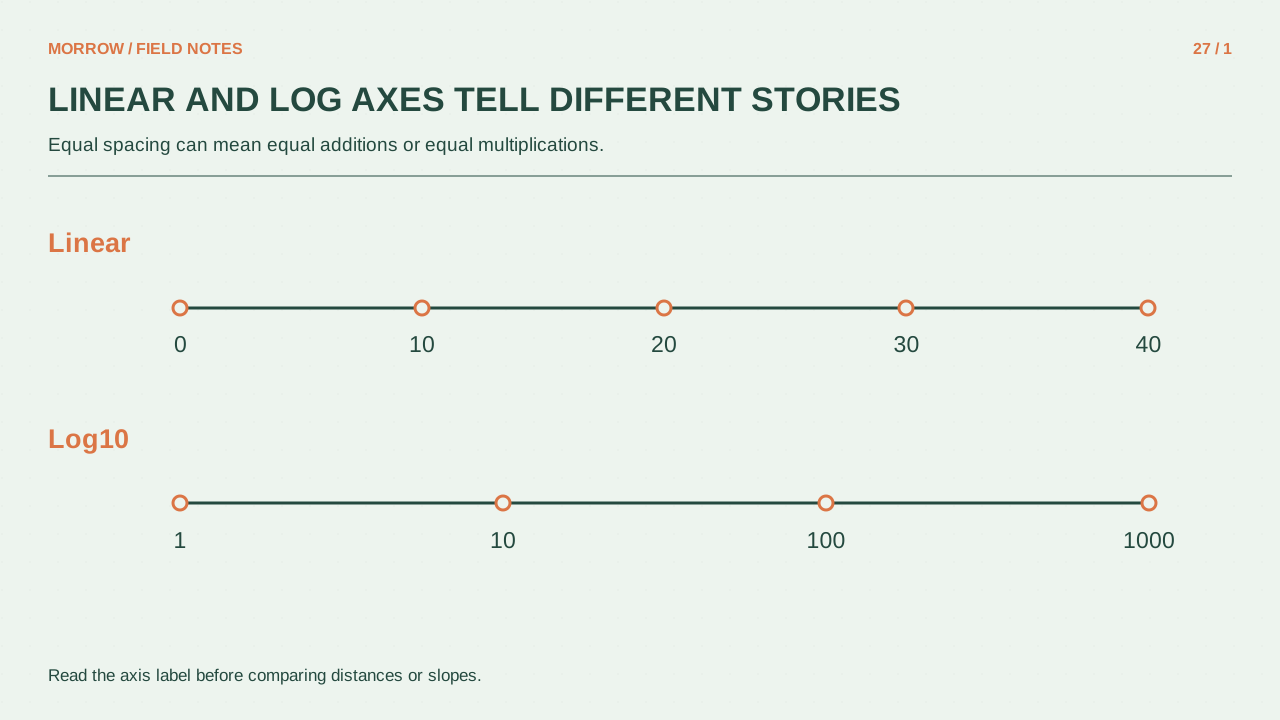
Every tenfold interval has the same length
On a base-10 log axis, moving from 1 to 10, from 10 to 100, and from 100 to 1,000 covers equal distances. The increases are 9, 90 and 900, but each is a multiplication by ten. OpenStax's explanation of logarithms connects them with exponential functions. Axis positions follow logarithms rather than the original numbers directly.
Place the invented values 10, 20, 40 and 80 at equally spaced times. Each doubles, so they rise by equal steps on a logarithmic vertical axis and form a straight line. Their absolute increases are 10, 20 and 40. By contrast, the values 10, 20, 30 and 40 add the same amount each time but move progressively shorter distances on a log axis.
The midpoint is not the arithmetic average
Halfway between 10 and 100 on a log axis is approximately 31.6, the square root of 10 multiplied by 100. It is not 55. Both 10 to 31.6 and 31.6 to 100 multiply by approximately 3.16. Read the smaller tick marks and labels instead of averaging the endpoints to estimate a value.
| Interval | Addition | Ratio | Log distance |
|---|---|---|---|
| 2 to 20 | 18 | 10 times | One decade |
| 20 to 200 | 180 | 10 times | The same decade |
| 10 to 20 | 10 | 2 times | Same as 100 to 200 |
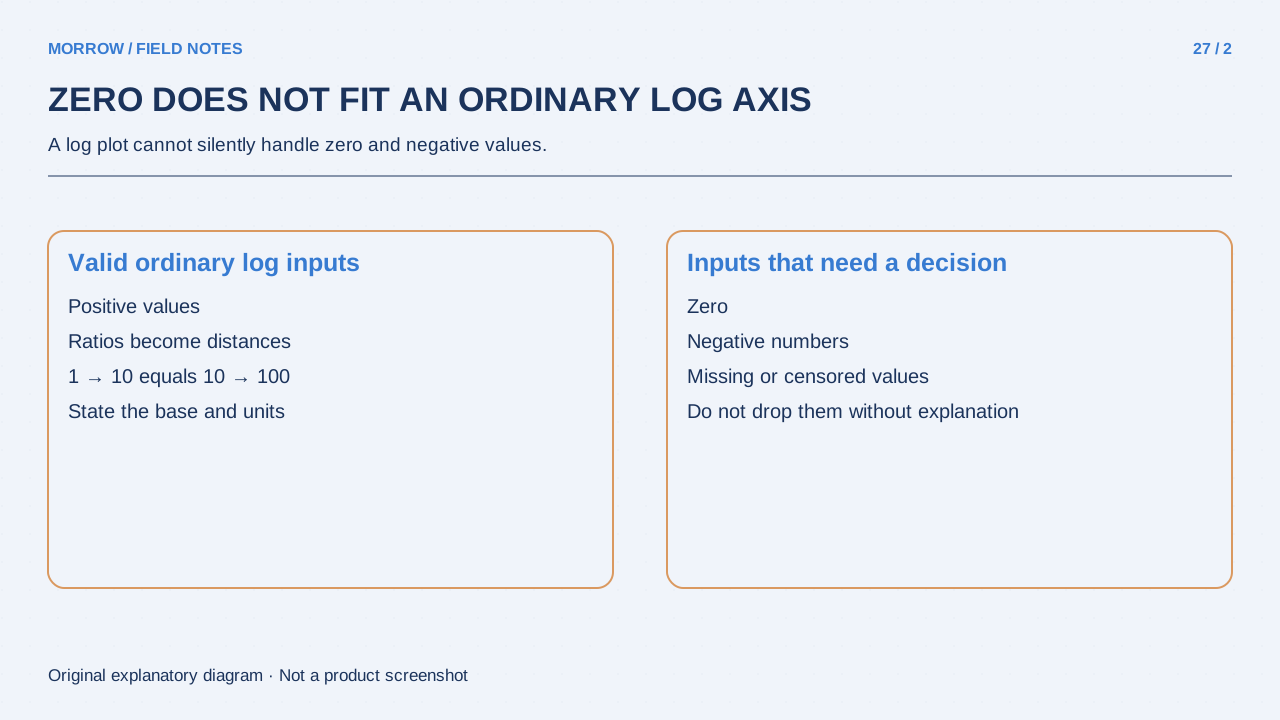
Ask what happened to zero and negative values
An ordinary real-valued logarithmic axis cannot display nonpositive values directly. Matplotlib's log-scale documentation illustrates masking or clipping such values. A missing point on the chart therefore may not mean the dataset lacks an observation. Check the plotting method and the underlying table.
If zero matters, show a linear companion chart or explain any alternative transformation. A symlog axis handles the region around zero differently from a conventional log axis. Adding one to every value also changes the interpretation; it should not be an unexplained fix.
Read four things before judging the trend
- Identify which axis is logarithmic.
- Check the base and the ratios between ticks.
- Separate questions about additions from questions about multiples.
- Find how zeros, negatives and missing observations were handled.
A range from 10 files to 10,000 files may benefit from a log axis. If your question is how many additional files appeared, a linear chart or the original counts may communicate that more directly. A logarithmic chart is not automatically deceptive or automatically fair. Its usefulness depends on the question. As a reader, your first safeguard is to stop translating equal visual height into equal numerical increase.
Related practical guides
Original illustrations created to help explain this article.