How to Read a Stress–Strain Curve: Yield Strength, Tensile Strength, and the 0.2% Offset
This article was translated from its source language with AI assistance. Please check technical terms and equations against the original.
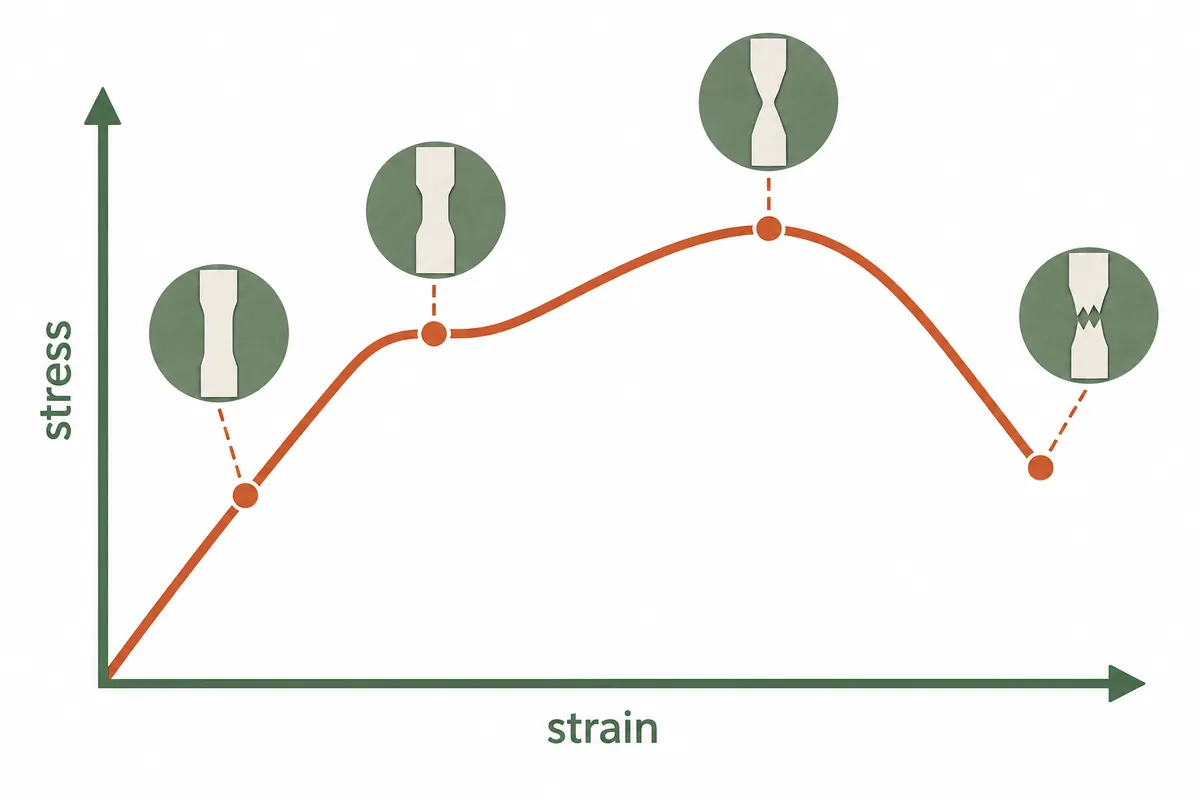
A stress–strain curve is a graph showing how much a material withstands and how it deforms during a tensile test. The initial slope gives the elastic modulus, the region near yielding shows the onset of plastic deformation, the peak gives tensile strength, and the final point indicates fracture. This article explains the curve using engineering stress and engineering strain.
The Order for Reading a Stress–Strain Curve
First, check whether strain on the horizontal axis is expressed as a ratio or a percentage, and check the stress units on the vertical axis. Then examine the initial straight line, yielding, the peak, and the fracture point in order. The illustration below is an example explaining the behavior of a typical ductile material; not all materials exhibit the same shape.
Comparing Elastic Modulus, Yield Strength, and Tensile Strength
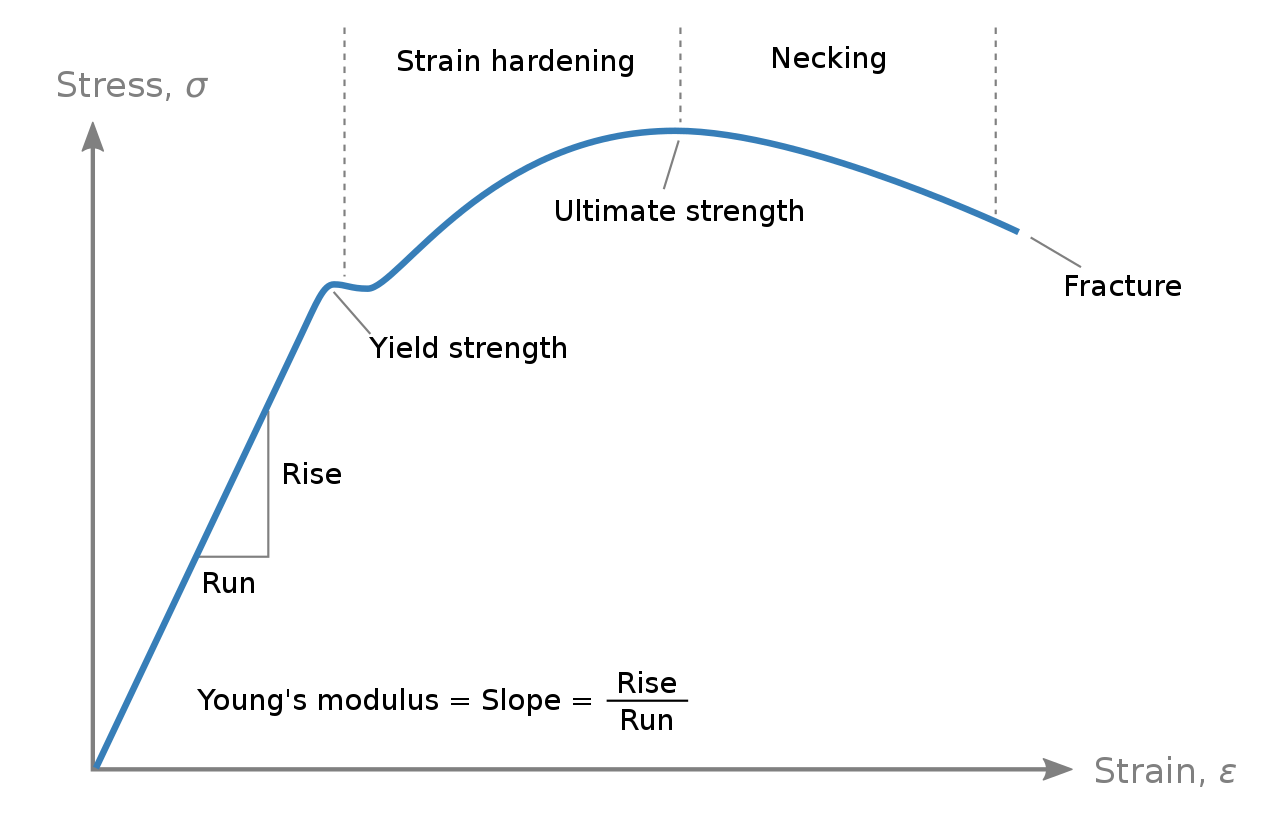
| Property | Where to read it on the curve | Meaning |
| Elastic modulus E | Slope of the initial linear elastic region | Material stiffness |
| Yield strength | Yield point or defined offset intersection | Stress criterion for identifying plastic deformation |
| Ultimate tensile strength (UTS) | Peak engineering stress | Maximum load divided by initial cross-sectional area |
| Fracture strain | The final point where the specimen breaks | Strain at fracture |
The Elastic Region and Elastic Modulus
Elastic deformation is deformation that recovers when the load is removed. In the linear elastic region, σ = Eε, and E is the slope obtained by dividing the change in stress by the change in strain. If stress is entered in MPa and strain as a dimensionless ratio, E is also obtained in MPa. A larger elastic modulus gives a smaller elastic strain at the same stress.
The elastic modulus represents a material's stiffness and is not the same value as yield strength or tensile strength. Nor does elastic behavior necessarily mean linear behavior.
Yield Strength and the 0.2% Offset
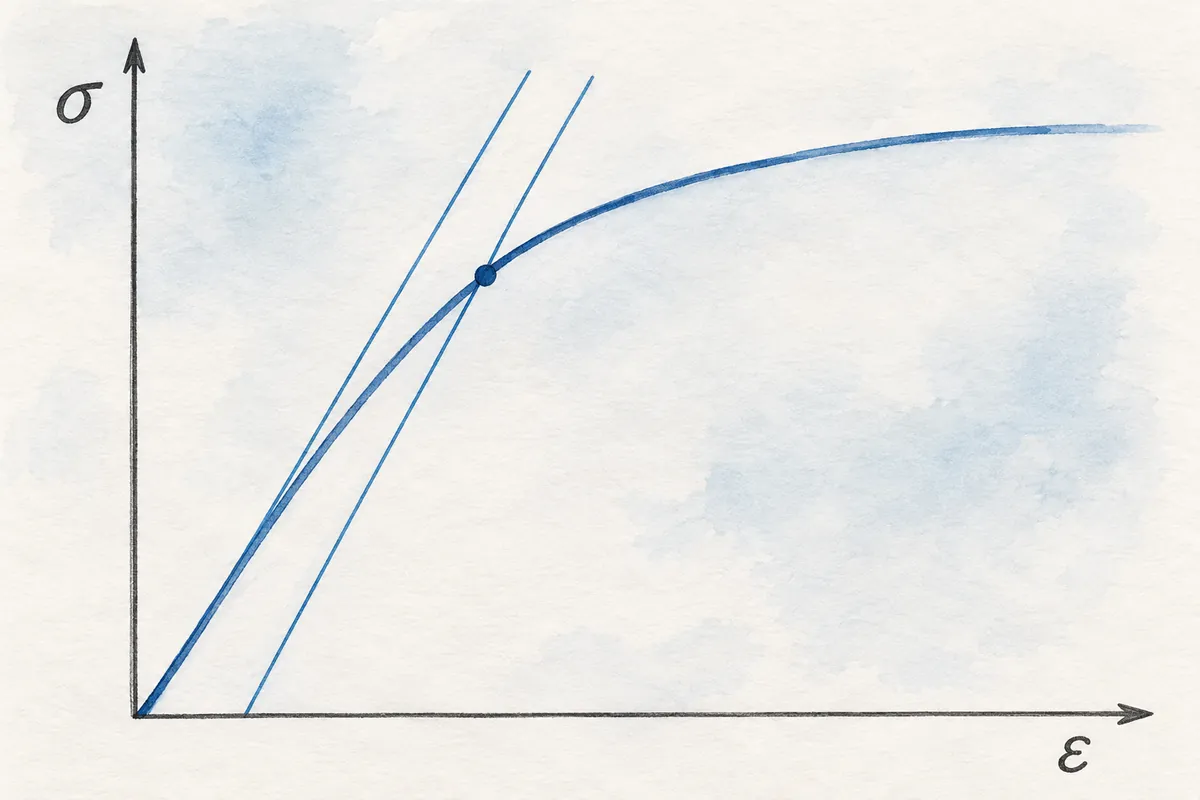
For a material without a distinct yield point, an offset yield strength corresponding to a specified permanent strain is used. In the 0.2% offset method, draw a line parallel to the initial elastic line from ε = 0.002 on the strain axis, and read the stress at its intersection with the curve.
0.2% = 0.002; it is not 0.002%. The intersection means the point where the two lines meet, not a condition of tangency. In an actual test, check the definition in the applicable standard and the method of measuring strain.
The Plastic Region and Strain Hardening
Plastic deformation is permanent deformation remaining after the load is removed. Elastic and plastic deformation may coexist even after yielding. Do not assume that stress and strain remain linearly proportional.
Strain hardening is the phenomenon in which the stress required for further deformation increases as plastic deformation progresses. In metals, it involves dislocation multiplication and interactions, among other factors. Its extent varies with the material, temperature, and deformation conditions.
Tensile Strength, Necking, and Fracture Are Different
Engineering ultimate tensile strength (UTS) is the maximum load Fmax divided by the initial cross-sectional area A0. It corresponds to the peak of the engineering stress–strain curve and does not necessarily equal the stress at the moment of fracture.
Necking is the localization of deformation and cross-sectional reduction in a particular part of the specimen. In a tensile test of a typical ductile metal, engineering stress may decrease as necking progresses after the maximum load. Since engineering stress is calculated using the initial cross-sectional area, it must be distinguished from true stress, which uses the actual instantaneous area.
Curves for Ductile and Brittle Materials
Ductile materials undergo relatively large plastic deformation before fracture, while brittle materials may break with little plastic deformation. A brittle material may lack a distinct yield point, so do not generalize that it necessarily fractures near its yield strength. Behavior is also affected by test temperature, speed, defects, and other factors.
Related Reading and References
- Differences Between Ductility and Brittleness, with Material Examples
- Differences Between Elasticity and Plasticity, and Calculating Residual Deformation
- The Meaning of Toughness and Interpreting the Charpy Test
- MIT OpenCourseWare: Stress–Strain Curves
- MIT Tensile Test Exercises: The 0.2% Offset and Tensile Strength
Original illustrations created to help explain this article.
Original on Tistory ↗