Elasticity Versus Plasticity: Recovery, Yielding, and Calculating Residual Deformation
This article was translated from its source language with AI assistance. Please check technical terms and equations against the original.
The difference between elasticity and plasticity is whether deformation remains after unloading. Elastic deformation recovers when load is removed; plastic deformation remains permanently. Unloading paths on stress–strain curves distinguish them.
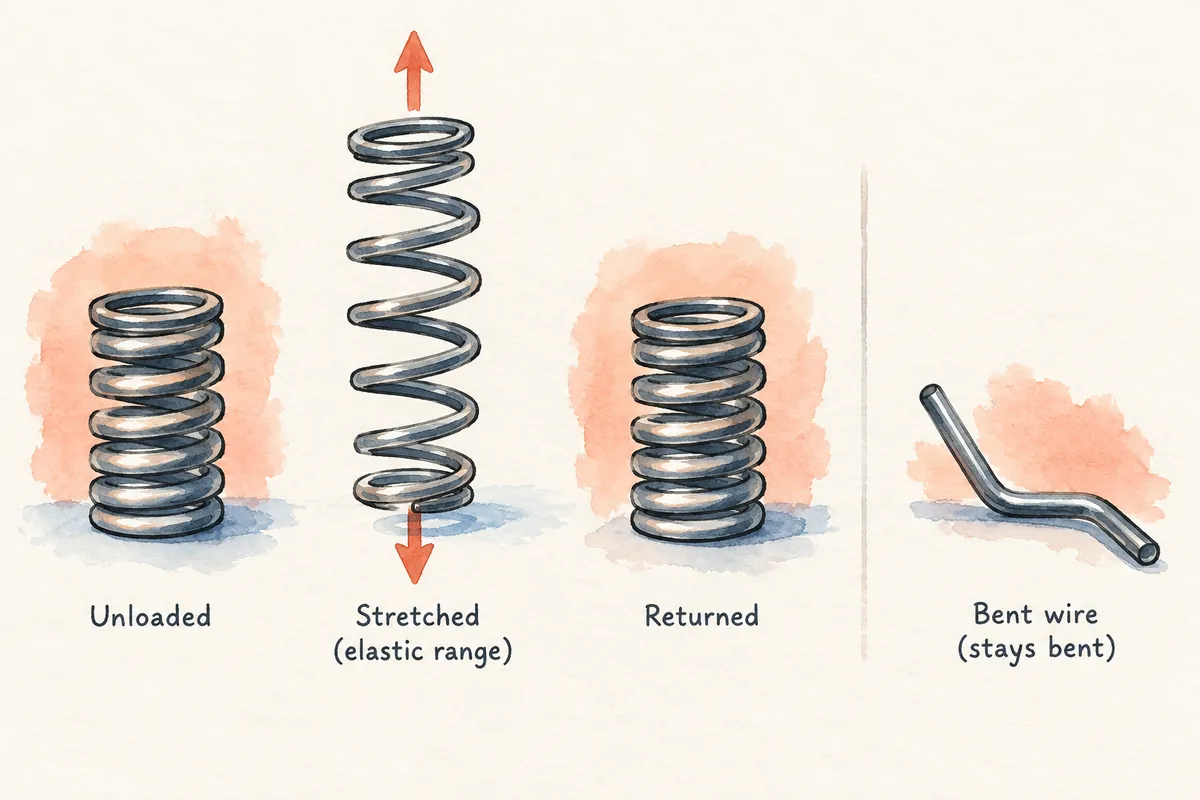
Comparison of Elasticity and Plasticity
| Category | Elasticity | Plasticity |
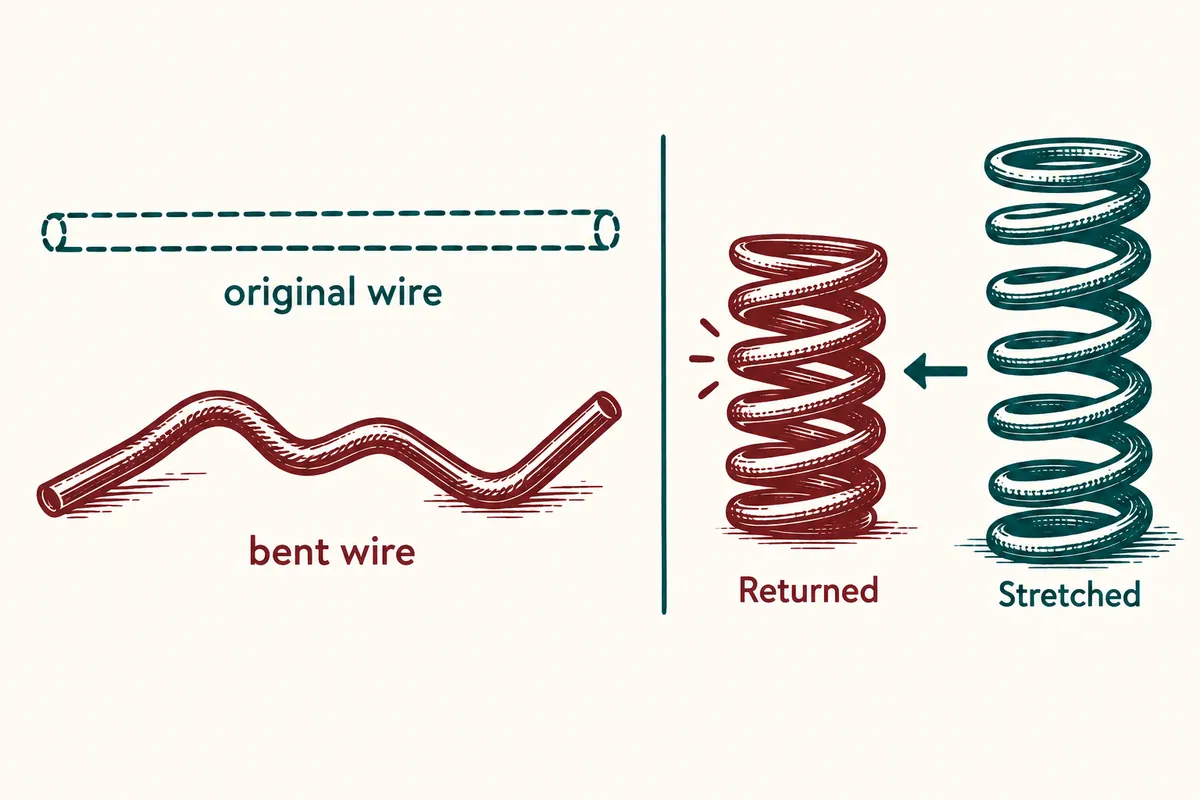
| After unloading | Deformation recovers | Permanent deformation remains |
| Representative example | Metal spring within its elastic range | Metal wire retaining its shape after bending |
| Curve indication | No residual strain at zero stress | Residual strain at zero stress |
| Common confusion | Elastic behavior need not be linear | Elastic deformation coexists during plastic deformation |
Recovering and Remaining Parts of Total Strain
A small-strain uniaxial elastoplastic model divides total strain as ε = εe + εp. Assuming linear elastic unloading, recovered elastic strain is εe = σ/E, and remaining plastic strain is εp = ε − σ/E. E is elastic modulus.
For σ = 200 MPa, E = 200,000 MPa, and total ε = 0.005, elastic strain is 0.001 (0.1%) and plastic strain 0.004 (0.4%). This illustrates the model, not measured results for a particular material.
Elasticity
Elasticity is the property of returning to original dimensions after applied load is removed. Stress–strain diagrams showing tensile or compressive behavior explain it.
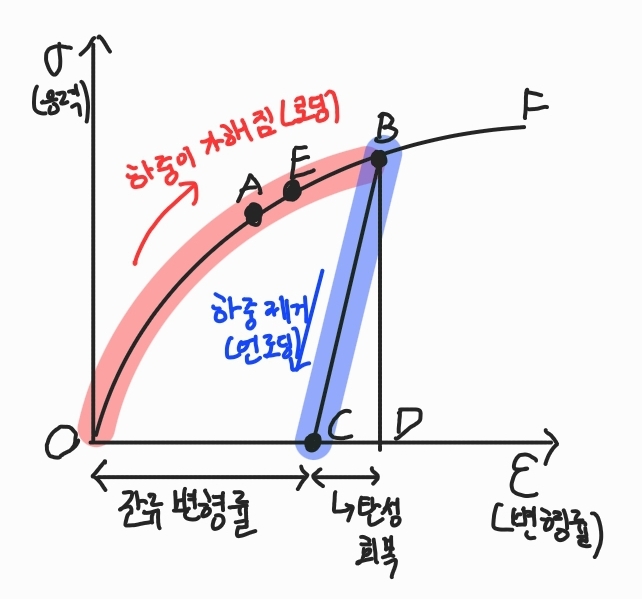
Suppose a tensile specimen is loaded from origin O to A (Figure 1a). Unloading returns it along the same curve to O. This property is elasticity, and such a material is elastic. The O–A curve need not be linear, but original dimensions must be recovered.
Now load the same material farther to B (Figure 1b). Unloading follows BC, parallel to the initial loading curve, or its tangent at the origin. At C, load is fully removed, but residual or permanent deformation OC remains. The tested bar is longer than before loading; this residual extension is permanent deformation. Of total deformation OD developed from O to B, CD recovers elastically and OC remains. The bar therefore returns only partly to its original shape during unloading and is partly elastic.
Between A and B there must be a point before which behavior is elastic and beyond which it is only partly elastic. Find it by loading to a chosen stress and unloading. If extension returns to zero, with no permanent deformation, the material is fully elastic up to that stress.
Repeat loading and unloading at increasingly high stresses. Eventually a stress is reached where unloading does not recover all deformation. This establishes the elastic region's upper stress, such as at E in Figures 1a and 1b: the elastic limit.
Many materials, including most metals, have an initial linear stress–strain region. Its upper stress is the proportional limit. The elastic limit usually equals or slightly exceeds it, so both often receive the same numerical value. In mild steel, yield stress is also close, and practical purposes treat all three alike. This does not apply universally. Rubber illustrates elastic behavior far beyond the proportional limit.
Plasticity
Figure 1's stress–strain curve shows tensile or compressive behavior. Loading increases stress and strain from O. Initially deformation is elastic and unloading restores the original state, following O–A.
Loading farther reaches B. Unloading follows BC, parallel to the initial curve. At C the load is fully removed but residual or permanent deformation OC remains.
This permanent deformation means plastic deformation occurred. Of total OD developed during O–B loading, CD recovers elastically while OC remains permanently. Thus unloading restores the bar's shape only partly.
Between A and B, a point marks transition from fully to partly elastic behavior. Beyond it, original length is not fully restored on unloading. The upper elastic-region stress at E is the elastic limit.
Many materials, particularly most metals, begin with a linear region whose upper stress is the proportional limit. The elastic limit usually equals or slightly exceeds it; mild-steel yield stress is also close. Not all materials share this: rubber retains elastic behavior well beyond the proportional limit.
In the plastic region of Figure 1, large deformation does not return to the original shape; this is plastic flow. It characterizes permanent deformation under load.
Frequently Asked Questions
Are elastic limit, proportional limit, and yield strength identical? The proportional limit ends linear stress–strain proportionality; the elastic limit ends full recovery. Yield strength is a criterion for plastic deformation, using definitions such as 0.2% offset without clear yield points. Do not treat all three as identical for every material.
Is extensive stretching, like rubber, plastic? Large deformation alone does not establish plasticity. Check recovery after unloading. For polymers, also consider time-dependent recovery and viscoelasticity.
Related Articles and Supporting Materials
Original illustrations created to help explain this article.
Original on Tistory ↗