Reading Surface Roughness Ra: Why Measurement Length and Direction Matter
This article was translated from its source language with AI assistance. Please check technical terms and equations against the original.
Key takeaway: Ra is the average of the absolute height deviations of the evaluated profile. When comparing values, check not only units but also profile type, filtering, evaluation length, position, and direction.
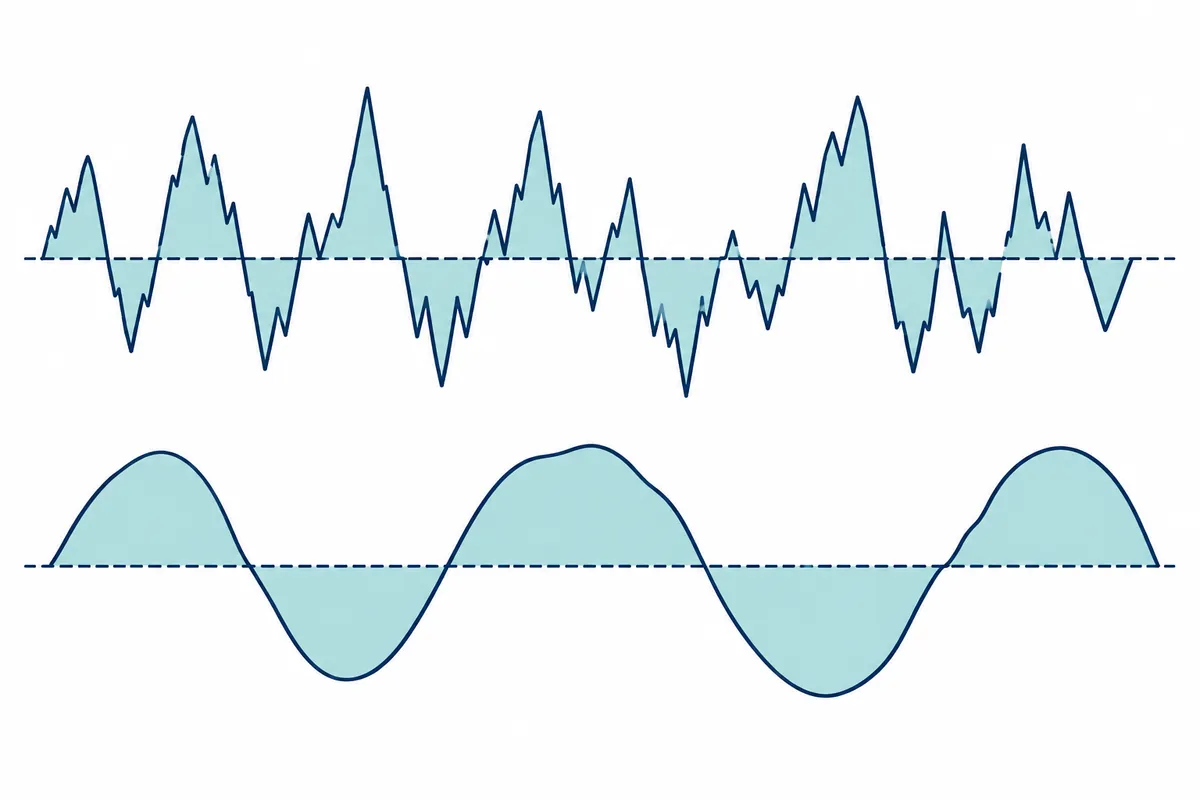
The process at a glance
This is an explanatory diagram, not a screenshot or the results of an actual test.
1. Check Ra and its units
2. Read profile and filter conditions
3. Record evaluation length and measurement position
4. Compare machining lay and measurement paths
5. Compare only results obtained under matching conditions
What is missing from a results table that gives only Ra
If two surfaces both have Ra listed as 1.2 µm, it is easy to think they are identical. An average, however, does not preserve the full arrangement of heights. Different measurement positions, lengths, or profile-processing methods can change what the same number represents. First check whether the values were obtained under matching conditions, and distinguish whether the desired surface function can be adequately described by mean height alone.
This article is an introductory explanation of reading roughness reports. It is not a report of measuring specimens or calibrating equipment, and it does not determine whether a particular product passes inspection. The height arrays below are original, equally spaced fictional data created to illustrate the equation. It does not claim that simply applying the equation to an instrument's raw signal yields Ra as defined by every standard.
Ra averages the magnitude of height deviations rather than their signs
Consider a profile expressed as positive above the mean line and negative below it. Adding positive and negative values directly can cause cancellation, so Ra instead averages the absolute values of height deviations. NIST's parameter explanation defines it as the arithmetic average deviation. With equally spaced fictional data, we can create a simple example by dividing the sum of absolute values by the number of points.
The assumption that the mean line and profile to be evaluated have been established matters. An instrument's reference height is not necessarily the mean line. Tilt, form components, and filtering belong to the actual evaluation conditions. First check whether the numerical array has a mean of zero, and do not confuse the mean obtained after removing signs with another parameter based on squares.
가상 등간격 높이 편차, 단위 µm
z = [-2, -1, 0, 1, 2]
mean(z) = (-2-1+0+1+2)/5 = 0
abs(z) = [2, 1, 0, 1, 2]
Ra_example = (2+1+0+1+2)/5 = 1.2 µm

참고용 제곱 평균 제곱근
Rq_example = sqrt((4+1+0+1+4)/5)
           = sqrt(2) ≈ 1.41421356 µm
Ra와 Rq는 서로 다른 계산입니다.
이 배열은 실제 장비 측정·필터 처리·규격 평가를 대체하지 않습니다.| Fictional profile | Height array (µm) | Mean of absolute values | Array maximum − minimum |
| A: gradual array | −2, −1, 0, 1, 2 | 1.2 µm | 4 µm |
| B: flat center, large endpoints | −3, 0, 0, 0, 3 | 1.2 µm | 6 µm |
| C: all deviations zero | 0, 0, 0, 0, 0 | 0 µm | 0 µm |
| D: twice A's amplitude | −4, −2, 0, 2, 4 | 2.4 µm | 8 µm |
| Comparison of A and B | Mean line zero; same number of points | Same Ra | Different extreme-value ranges |
| Unit conversion example | 1.2 µm = 0.0012 mm | Record the unit name too | Do not arbitrarily label the range as standard-defined Rz |
The same Ra can correspond to different height distributions
A and B above both have an absolute-value sum of 6 and five points, giving an average of 1.2 µm. However, A's maximum-minus-minimum difference is 4, while B's is 6. The same average alone does not establish whether high peaks or deep valleys have the same size. If surface function is sensitive to particular protrusions or valleys, examine the additional information needed for that purpose.
This comparison is an original arithmetic counterexample. It is not a test of a particular material's friction, sealing, paint adhesion, or fatigue characteristics. Nor does it conclude that smaller Ra always improves every function. The relationship to performance must be checked separately using evidence relevant to the material, mating surface, lubrication, contact conditions, and other aspects of the problem.
Match profile types and filter conditions first
Check profile designations such as R, P, and W and the filter conditions in the report. Educational materials from NIST and Mitutoyo distinguish height parameters by profile type and explain the context of processing roughness and longer-wavelength components. Comparing numbers from different processing conditions directly can mix surface differences with processing differences.
When recording filter names and cutoff values, also state which parameter used those settings. Apparently identical setting numbers can have different units or evaluation methods. Do not transfer example settings from the materials into recommendations for every specimen. Check the edition and conditions of the standard required by the actual drawing, contract, or test procedure.
Evaluation length and total traverse distance are different
Distinguish the instrument's total travel length from the evaluation length used to calculate the result. Details such as allowances at the start and end must be checked according to the procedure and instrument. If a report gives only one length, ask what that length represents. Do not treat results obtained with longer or shorter lengths as repeat values over the same measurement scope.
Small components may not provide a sufficiently long path. If you use a short measurement, record the modified length and applicable procedure so it can be compared later. This article does not automatically assign a pass or fail because a short path was used. Consult the relevant evaluation method for handling cases where the required length cannot be met.
Why measurement direction must be recorded
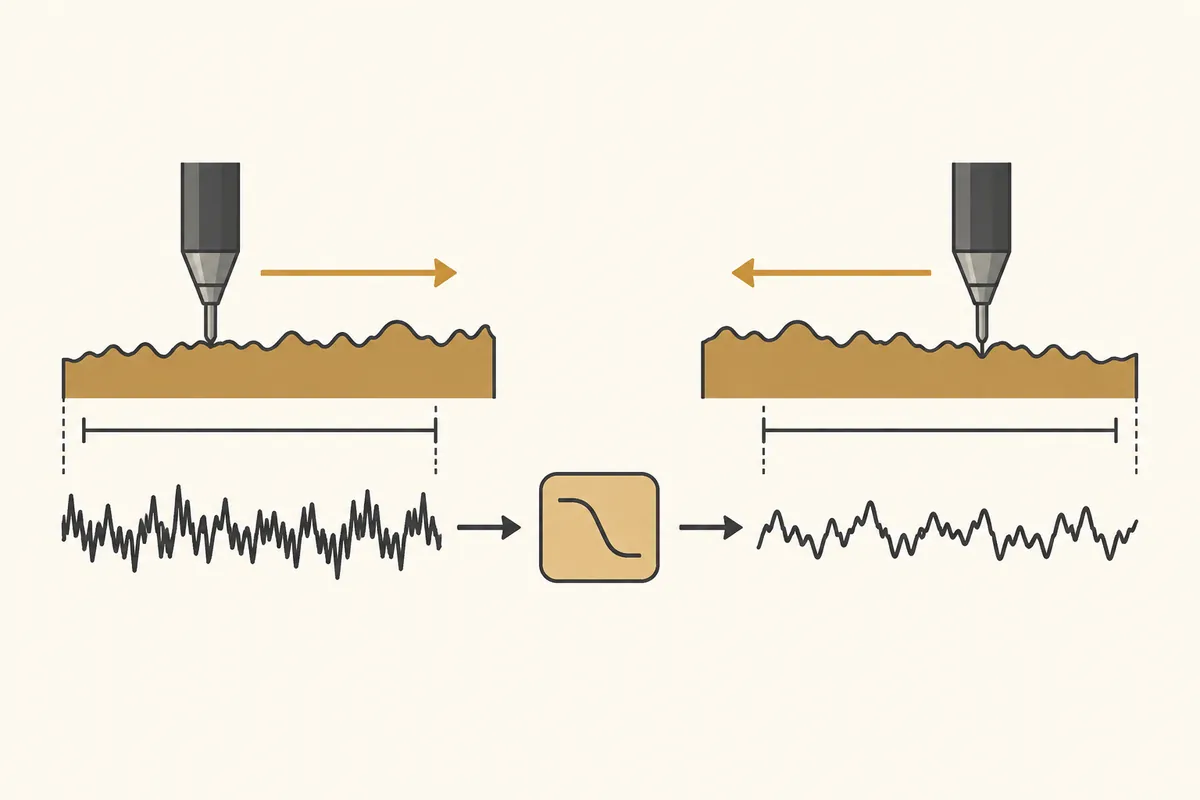
Suppose a surface has machining lay in one direction. A path crossing the lay and one following it may encounter different height variations. This is a geometric example explaining a directional surface. The actual measurement direction must follow the requirements of the surface and applicable procedure; you can record why the direction was chosen and its angle relative to the specimen.
For example, define the length direction as x and the width direction as y, then mark the x and y paths separately to make measurement positions easier to locate later. A note saying only vertical measurement can change meaning when the specimen is rotated. Do not assume that all directions across the surface are identical based on a result from one arbitrary direction.
| Report item | What to record | Fictional example record |
| Specimen and surface identification | A name distinguishing it from other surfaces | Specimen A / machined surface 1 |
| Position | Reproducible path start and region | Near x=10 mm in drawing coordinates |
| Direction | Specimen coordinates or relationship to machining lay | Path in the x direction; actual angle indicated separately |
| Parameter | Profile type and name | R profile / Ra |
| Units | Separate height units from length units | Ra: µm / path length: mm |
| Filter | Method, cutoff, and required conditions | Record directly from the instrument settings table and procedure |
| Evaluation length | The length used for the result | State both the value and the definition of length |
| Contact or noncontact | Measurement method and instrument identification | Stylus instrument model and tip conditions |
| Repeat results | Record values at each position separately | Retain raw values for positions 1, 2, and 3 |
| Applicable procedure | Standard name and edition; internal criteria | Identifier of the document actually applied |
Stylus size and measurement spacing are also result conditions
In contact measurements, stylus geometry and radius are among the measurement conditions. How narrow valleys and rapid height changes are read can depend on instrument characteristics and processing conditions. NIST's calibration document specifies particular equipment, settings, and uncertainty factors. Do not use its numerical values as defaults for every measuring instrument.
If a report gives only an instrument name, check whether the required tip, spacing, and filter settings exist in separate records. When different measurement methods give different values, check whether they evaluated the same surface, path, and conditions before deciding one is wrong. Do not assume or record that equipment was calibrated if you have not investigated its actual calibration status.
Do not miss the factor of a thousand when converting µm and mm
Since 1 mm is 1000 µm, 1.2 µm equals 0.0012 mm. If heights are in µm and path lengths in mm, both units appear in the same report. Keep the unit column when copying numbers into another program. For example, interpreting 1.2 as mm would record a value a thousand times the original height.
Conversely, read the unit before being surprised by an apparently tiny displayed value of 0.0012. If a table's column heading contains a unit, interpret each row's number accordingly. When merging files, keeping a column converted to common units separately from the original values and units makes the conversion process easier to review.
Preserve conditions and original values before averaging repeats
Values can vary by surface position, so define the purpose of repeated measurements. Distinguish repeating the same path from surveying several positions to avoid confusing instrument repeatability with positional differences. Keeping only an average makes it difficult to revisit a large value at one position and its measurement conditions.
The fictional results 1.0, 1.2, and 1.4 µm average to 1.2 µm, but that average cannot reconstruct where those three values came from. Record position, direction, and whether settings matched for each row. This is arithmetic only, not an actual assessment of repeatability or uncertainty. Follow the applicable procedure for using repeat values in acceptance decisions.
Distinguish older educational materials from current applicable requirements
Roughness materials may contain ISO or JIS standard numbers and editions current when they were written. Publication by an official institution or manufacturer does not automatically make them match the edition required by your current contract or specification. The sources here were read to explain principles and reporting items; no particular standard edition is presented as a universal current obligation.
First identify the name, edition, and separately specified conditions of the standard required for your evaluation, then read educational equations and symbols in that context. Even the name Rz should not be attached to an arbitrary maximum-minus-minimum array value without checking its definition. The array range in the calculation example was labeled as a range, without claiming a standard parameter evaluation.
Minimum conditions for concluding that results are comparable
Before comparing results, check that parameters and units match and that positions, directions, lengths, filters, and measurement methods align with the purpose. Different conditions leave a further step: explaining the difference or reevaluating under identical conditions. Similar-looking numbers alone do not establish identical surface condition or performance.
A useful final note preserves the Ra value together with its condition table, the procedure actually applied, and unverified items. The fictional arrays here illustrate the information limits of an average parameter; the record table was created as an aid for asking questions about measurement reports. No actual measurements, certification, or inspection passes were invented.
Official sources and verification scope
- NIST — Height parameters and the definition of Ra
- NIST — Surface roughness and step-height calibration conditions and uncertainty
- Mitutoyo — Surface roughness basics and profile types
Official materials checked: 2026-10-08. Items to recheck at publication: definitions, units, the edition of the standard actually applied, measurement paths, lengths, filters, and instrument conditions. Example settings in the cited materials are not universal recommendations.
AI-assisted writing. The cases, figures, and work records in this article are original explanatory examples. They are not presented as experiences or measurement results from an actual user's environment.
Original illustrations created to help explain this article.
Original on Tistory ↗