What Does a 30% Chance of Rain Mean? Probability of Precipitation
A 30% chance of rain means there is a 3-in-10 chance that measurable rain, at least 0.01 inch (about 0.25 mm) in the US, will fall at any given spot in the forecast area during the forecast period. Put another way, on many days with that same forecast, rain should fall on about 3 of every 10. It does not mean rain for 30% of the day, rain over 30% of the area, or light rain.
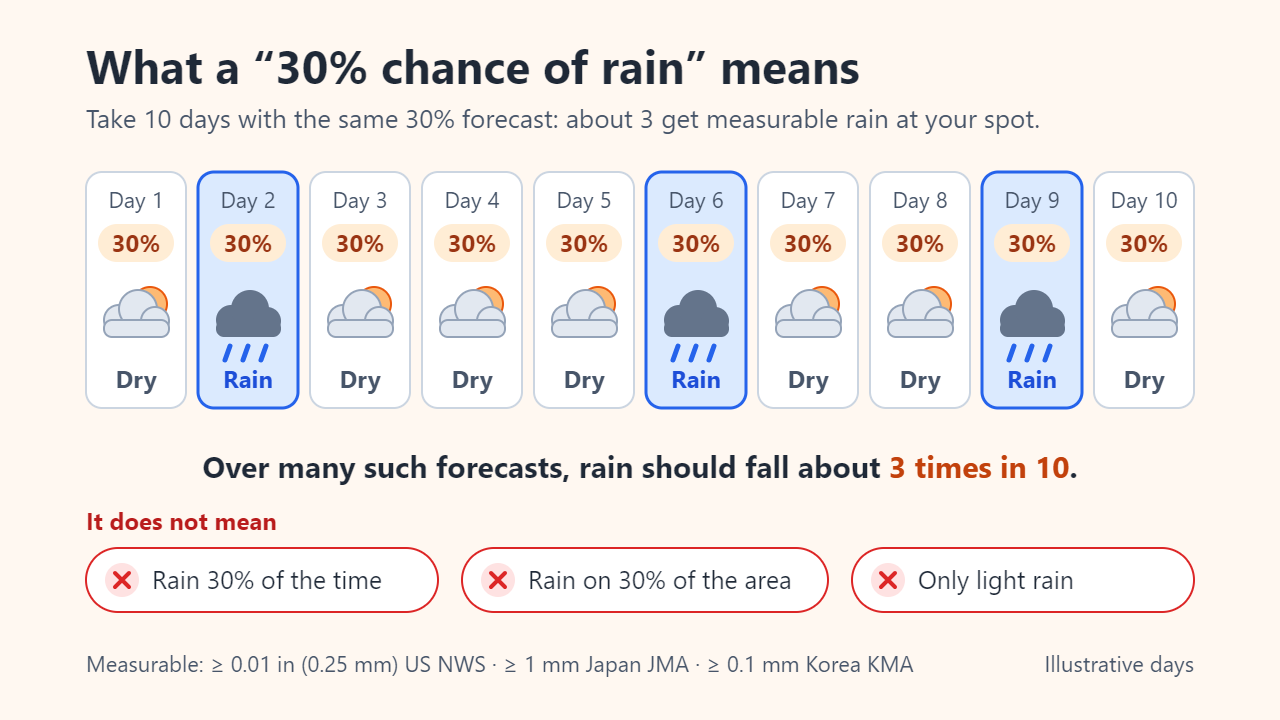
What the percentage does and doesn't tell you
The official term is probability of precipitation, or PoP. The US National Weather Service (NWS) defines it as the likelihood of a measurable amount of liquid precipitation, or the water equivalent of snow and ice, at any given point in the forecast area during a specified period. That definition has three moving parts: a minimum amount, a place and a time window. Change any of them and the number changes.
The most common misreadings:
- “It will rain 30% of the time.” PoP says nothing about duration. A 30% afternoon can bring a ten-minute shower, a three-hour soaking or nothing at all.
- “30% of the area will get wet.” The NWS explicitly rejects this reading. Coverage feeds into the number, but the result is a chance for each point.
- “30% means light rain.” How likely rain is and how heavy it would be are separate forecasts.
- “The forecaster is 30% sure.” In the US method, confidence is only one of two factors.
How the National Weather Service calculates PoP: C × A
NWS forecasters combine two judgments. C is their confidence that precipitation will form or move into the forecast area. A is the fraction of the area expected to get measurable rain if it does. Multiplying them gives the PoP for any point in the area.
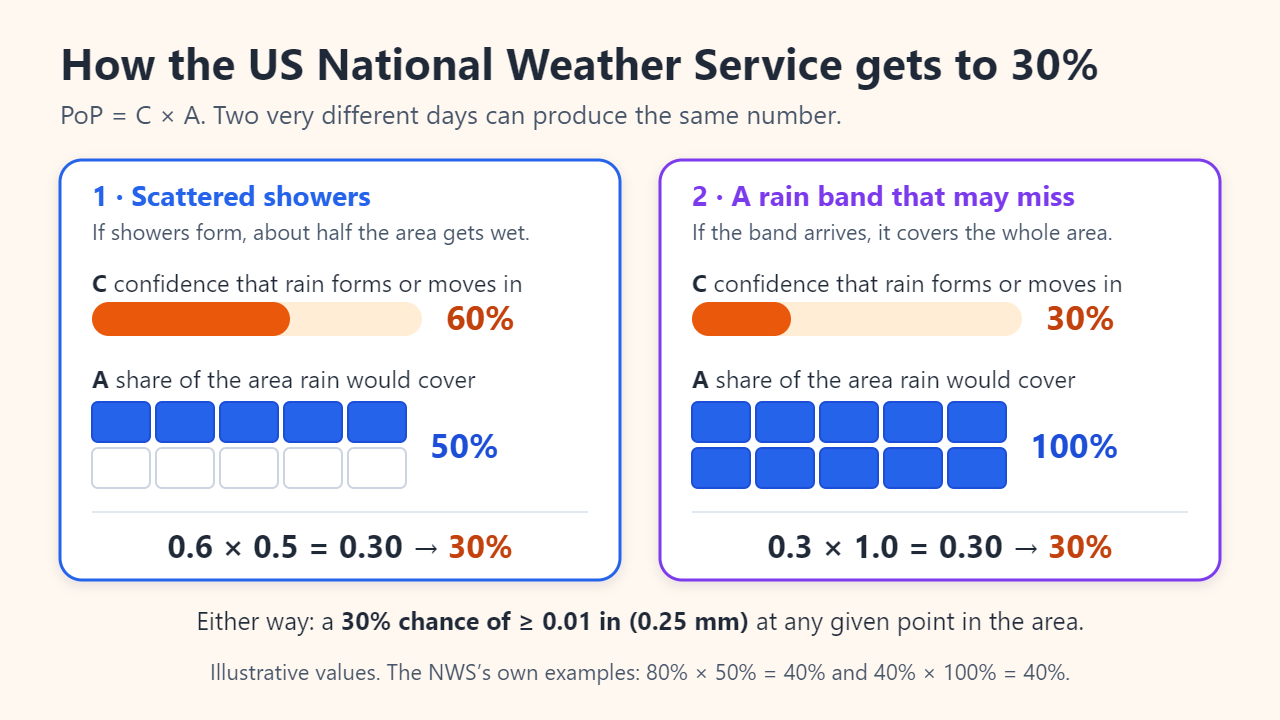
An NWS explainer from its Paducah, Kentucky office gives two routes to 40%: 80% confidence that showers develop with 50% expected coverage, or a solid rain shield covering 100% of the area that is only 40% likely to arrive. The same works at 30%: 0.6 × 0.5 and 0.3 × 1.0 both equal 0.30. The two days feel completely different, yet both are correctly forecast as a 30% chance at your location.
Unless stated otherwise, an NWS PoP covers 12 hours. Text forecasts also turn the number into words: 20% is a “slight chance,” 30–50% is a “chance” and 60–70% is “likely.” So a forecast reading “chance of showers” is telling you the PoP sits between 30% and 50%.
US, Japan and Korea count “rain” differently
Every agency measures its percentage against a minimum amount, and those thresholds differ by a factor of ten.
| Agency | Counts as rain | Place | Period |
|---|---|---|---|
| US National Weather Service (NWS) | ≥ 0.01 in (0.254 mm) | Any point in the forecast area | Normally 12 hours, unless stated |
| Japan Meteorological Agency (JMA) | ≥ 1 mm | The forecast area | 6-hour blocks, issued in 10% steps |
| Korea Meteorological Administration (KMA) | ≥ 0.1 mm | The specified place | The forecast period |
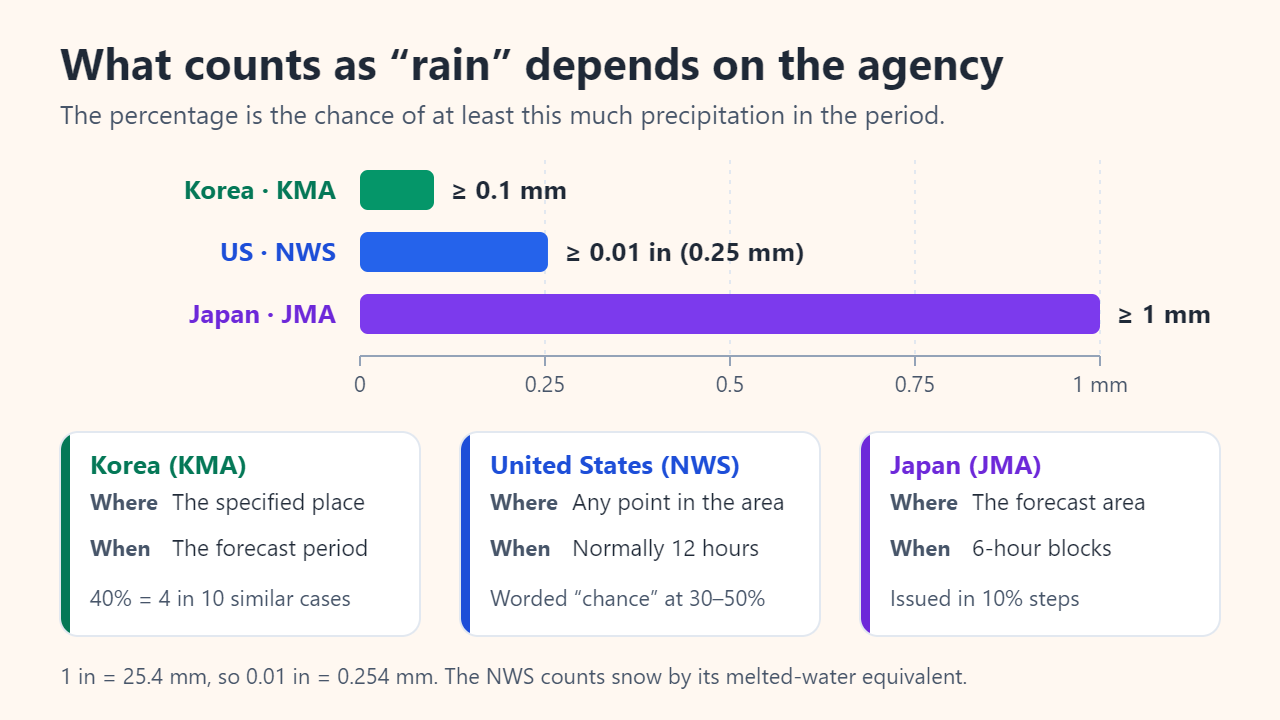
Japan's threshold is about four times the US one (1 ÷ 0.254 ≈ 3.9). A brief drizzle that counts as rain in the US or Korea may not count in Japan, so a low JMA percentage can still come with a few drops on your sleeve. The time window matters just as much: for the same threshold, the chance of rain over 12 hours can never be lower than the chance in any single hour within it. That is why hourly percentages in apps often look smaller than the day's headline number.
Chance of rain is not amount or duration
PoP answers a single yes-or-no question: will at least the threshold amount fall? KMA states it directly: the probability applies regardless of the intensity or amount of precipitation. A 70% chance of drizzle that leaves 1 mm and a 30% chance of a thunderstorm that drops 25 mm are both ordinary forecasts (illustrative numbers). The second is less likely but far more disruptive.
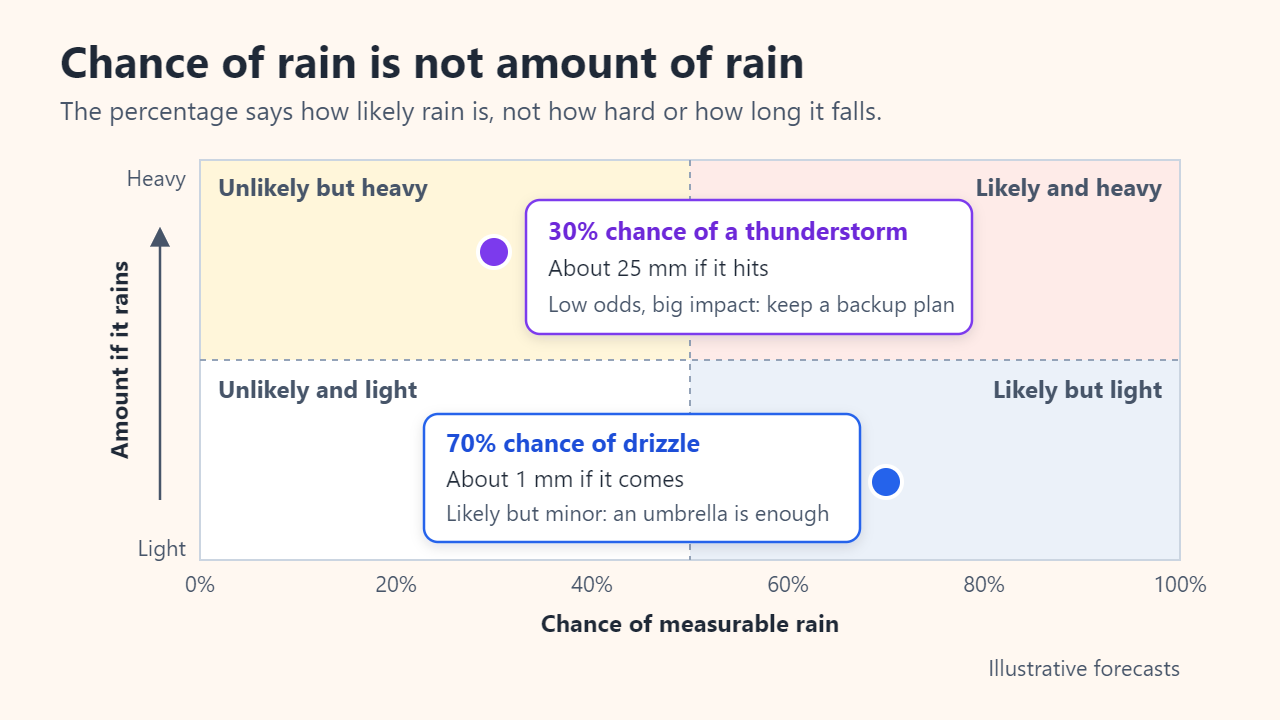
For amount, look at the expected rainfall total. For timing, use the hourly graph. For danger, read watches, warnings and advisories, which are issued separately from PoP.
Is a 30% forecast right 30% of the time?
A single forecast cannot be proved right or wrong: rain on a 30% day is not a miss, and neither is a dry one. Probability forecasts are judged over many cases. If an agency's 30% forecasts are well calibrated, rain follows about 30 times in every 100. KMA explains its numbers the same way: a 40% chance means rain fell in about 4 of 10 cases with similar weather.
JMA publishes reliability charts that test this. For December 2025 to February 2026, its nationwide 6-hour forecasts of 10% to 60% were followed by rain of 1 mm or more less often than stated, and a 40% forecast saw rain about 3 times in 10. The regional lines on the same chart also differ from one another: the percentage is a carefully made estimate, not a guarantee.
How to use the chance of rain in practice
- Check the period. Is the number for the whole day, a 12-hour or 6-hour block, or one hour? Compare like with like.
- Know the threshold. A low figure in Japan can still mean drizzle under 1 mm; a US or Korean figure counts much lighter rain.
- Look at amount and timing separately. Expected rainfall, hourly bars and any warnings tell you what PoP cannot.
- Weigh the cost of preparing against the cost of being caught. Prepare when the probability exceeds the ratio of the two. If carrying a jacket costs 1 unit of hassle and getting soaked costs 5, the break-even point is 1 ÷ 5 = 20%, so a 30% forecast is worth acting on (illustrative numbers).
- Recheck closer to the time. Forecasts are reissued several times a day, and each update draws on the latest observations.
FAQ
Does a 30% chance of rain mean it will rain for 30% of the day?
No. PoP is about whether measurable rain falls at a point during the period, not for how long. Check the hourly forecast for timing.
Why did it pour on a 30% day?
Because 30% events happen about 3 times in 10, and PoP gives no information about intensity. A 30% thunderstorm day can be much wetter than a 70% drizzle day.
Does the chance of rain include snow?
Yes. It is a probability of precipitation, and the NWS measures snow and ice by their melted water against the same 0.01-inch threshold.
Why do two weather apps show different percentages?
They may use different models, a different period such as hourly versus daily, or a different threshold. Compare numbers only when they describe the same place and time window.
Sources: NOAA JetStream weather glossary: precipitation probabilities (PoP); National Weather Service Paducah: precipitation probability (PDF); Japan Meteorological Agency: accuracy of precipitation probability forecasts, Dec 2025–Feb 2026 (PDF, Japanese); Korea Meteorological Administration: Weather Big Data Contest FAQ on probability of precipitation (Korean).
Related reading
Original illustrations created to help explain this article.