Why a graph looks exaggerated: reading axes differently in bars and lines
This article was translated from its source language with AI assistance. Please check technical terms and equations against the original.
The same numbers can create a very different impression when a vertical axis starts or ends elsewhere. Yet it is also inaccurate to conclude that every graph must start at zero. First ask whether the graphic compares lengths or shows positions and trends. All numbers below are fictional examples for explanation, not survey results.
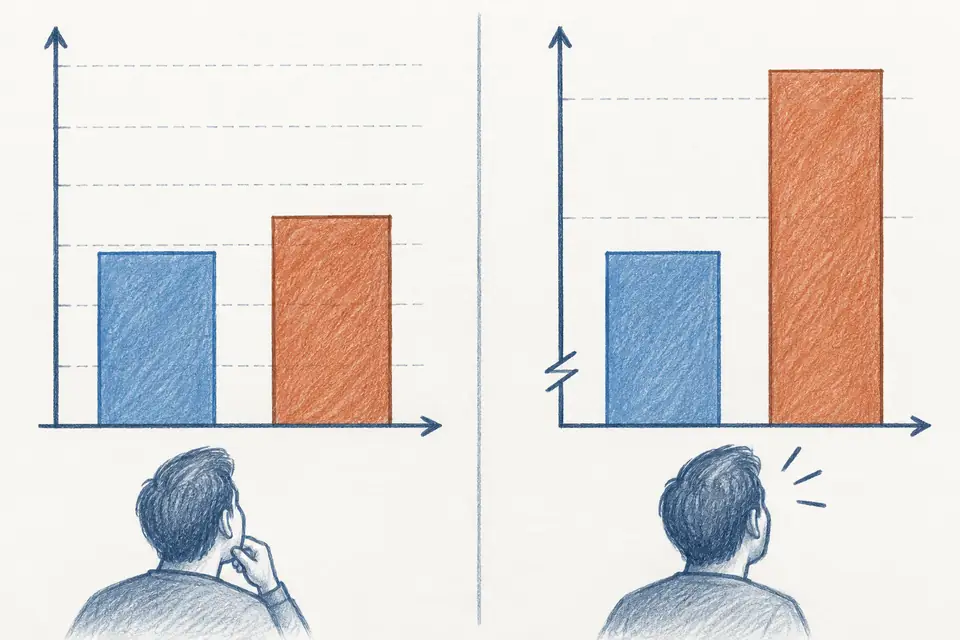
Bar lengths are measured from their baseline
Suppose two fictional shops sell 90 and 100 items. With bars starting at zero, the second is approximately 11.1% longer than the first. If the axis instead starts at 80, the visible lengths are 10 and 20, making one look twice as long. The ratio of visible bar lengths no longer matches the ratio of the actual quantities.
Bar charts usually encode quantity through length, making a zero baseline important. The UK Office for National Statistics' axis guide also recommends zero for bar and area charts. If differences are small, consider direct value labels or another representation rather than exaggerating them by cutting the baseline.
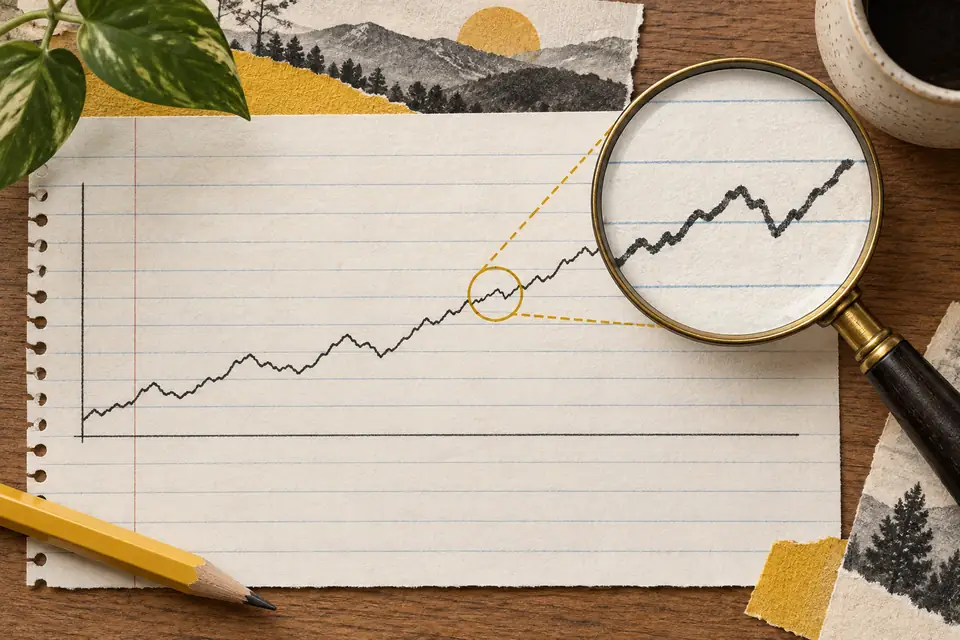
A line chart can use a range suited to the trend
In a separate fictional example, monthly quantities are 98, 99, and 100 items. A broad range starting at zero makes the change nearly flat. A line chart may use a range such as 95 to 102 to show changing point positions. Display the ticks and units clearly, and explain that the actual increase is two items, approximately 2.04% of the starting value.
The ONS line chart guide addresses trends over time. A steep-looking line does not necessarily mean a large change. The chart's width-to-height ratio also affects the perceived slope. Readers should check the starting value, ending value, and displayed period together.
Keep conditions consistent across comparison charts
If two small charts compare monthly trends at two locations, matching axis ranges helps direct comparison. Separately auto-scaled charts may make different magnitudes of variation look similar. Also check that the units and periods match before comparing.
Placing different units on two vertical axes can make two lines overlap or seem to move alike by chance. That appearance alone does not establish a relationship or a cause. Separate charts or a clearly explained transformation suited to the comparison may be easier to read. Either way, retain a traceable account of the original values and units.
Read the title and numbers together
Check the axis limits, unit, period, and source in order. Percent and percentage points also differ. A rate changing from 20% to 25% rises by five percentage points, while its relative increase from the initial rate is 25%. Read the accompanying statement to establish which quantity the graphic shows.
As the ONS chart text guide explains, a chart needs words that help interpretation too. Label fictional data as fictional, and identify the source and scope of real data. A useful visualisation lets readers check the magnitude and meaning of a change themselves instead of merely staging a dramatic change.
Original illustrations created to help explain this article.