Which World Map Is Right? Read Projection Distortion According to Purpose
This article was translated from its source language with AI assistance. Please check technical terms and equations against the original.
Different world maps make the same country's shape and size look different, inviting the question of which map is real. But transferring Earth's curved surface to a plane inevitably changes something. The useful question goes beyond whether distortion exists: what does the map preserve, what does it change, and what are you trying to judge with it?
1. A map chooses a rule for flattening Earth
A projection is a rule relating positions on Earth's surface to plane coordinates. USGS's projection guide explains that a flat world map cannot simultaneously show all directions, distances, areas, and shapes truly. A familiar-looking country therefore does not prove that every property of its map is accurate.
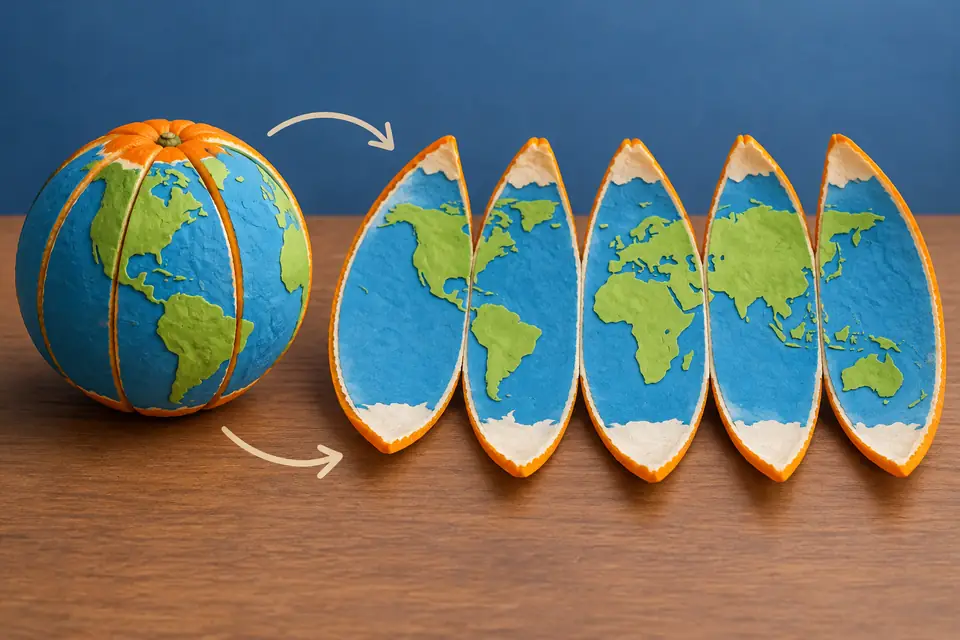
Imagine spreading orange peel flat on paper without tearing it. Something must wrinkle, stretch, or be cut. The analogy helps introduce the curved-to-flat problem, but is not the mathematical calculation of a particular projection. An actual map results from calculating coordinate positions, rather than physically stretching paper.
2. Preserving area differs from preserving angles
An equal-area projection preserves relative areas between regions. A conformal projection preserves angles and local shape in small regions, but not world-wide area ratios. USGS's working manual describes choosing projections for different purposes. Preserving one property does not guarantee all the others.
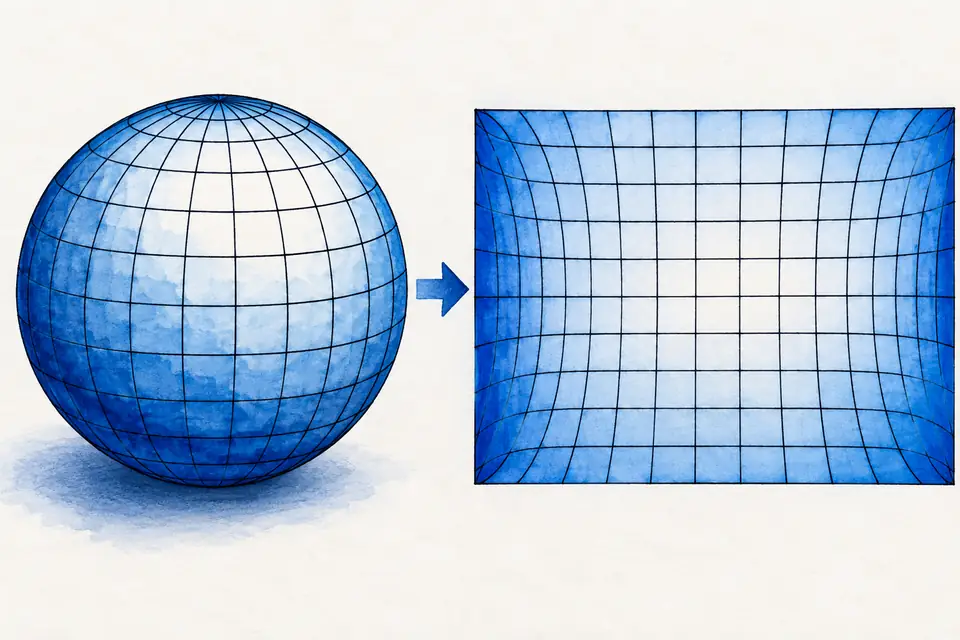
For an illustration comparing two regions' sizes, preserving area ratios matters. A picture showing local relationships such as street-intersection angles needs a different criterion. A conceptual drawing of two equal-area circles on a globe and how they change on a plane can help, provided it states the model's comparison purpose rather than presenting it as survey data.
3. Large high-latitude regions in Mercator do not prove large real areas
Mercator's area distortion increases away from the equator, making near-polar regions look enlarged. A straight line there is a constant-bearing rhumb line, but usually not the shortest route. USGS's Mercator description explains these properties. At global scales, do not automatically equate a straight line on a map with the shortest path.
Comparing a northern region with an equatorial one using screen-pixel area can mistake projection enlargement for real size. Reading neighborhood streets and comparing continents are different uses. Even if the same familiar online map serves several tasks, its appearance does not replace checking its suitability for each purpose.
4. Record the projection and comparison purpose
When creating or sharing a map, include the data source, projection, displayed region, and units of the compared value. Even “equidistant” does not mean every pair of points has a correct distance. A projection may preserve distances from a particular center or along particular lines, so check the relevant condition.
For practice, compare one region on a globe, an equal-area map, and a familiar rectangular world map. Write initial judgments from the shapes, then read the map descriptions and mark what needs revising. Instead of stopping at “this map is wrong,” define a useful boundary such as “do not compare national areas using screen area on this map.” Good map reading combines trusting a picture with checking its rules.
Original illustrations created to help explain this article.