Reading Poll Numbers: Checking Sample Size, Sampling Error, and Confidence Interval
This article was translated from its source language with AI assistance. Please check technical terms and equations against the original.
Looking at the survey results showing 52% in favor and 48% against, you might feel that the difference is distinct. However, how should you interpret the accompanying explanation of a margin of error of ±3 percentage points and a 95% confidence level? You must look beyond the magnitude of the numbers to consider the survey subjects, the sampling method, and the items being compared. This article does not aim to predict the results of actual elections or specific policies; instead, it uses hypothetical examples to explain the basic distinctions between sampling, error, and intervals necessary for interpreting survey figures in the news.
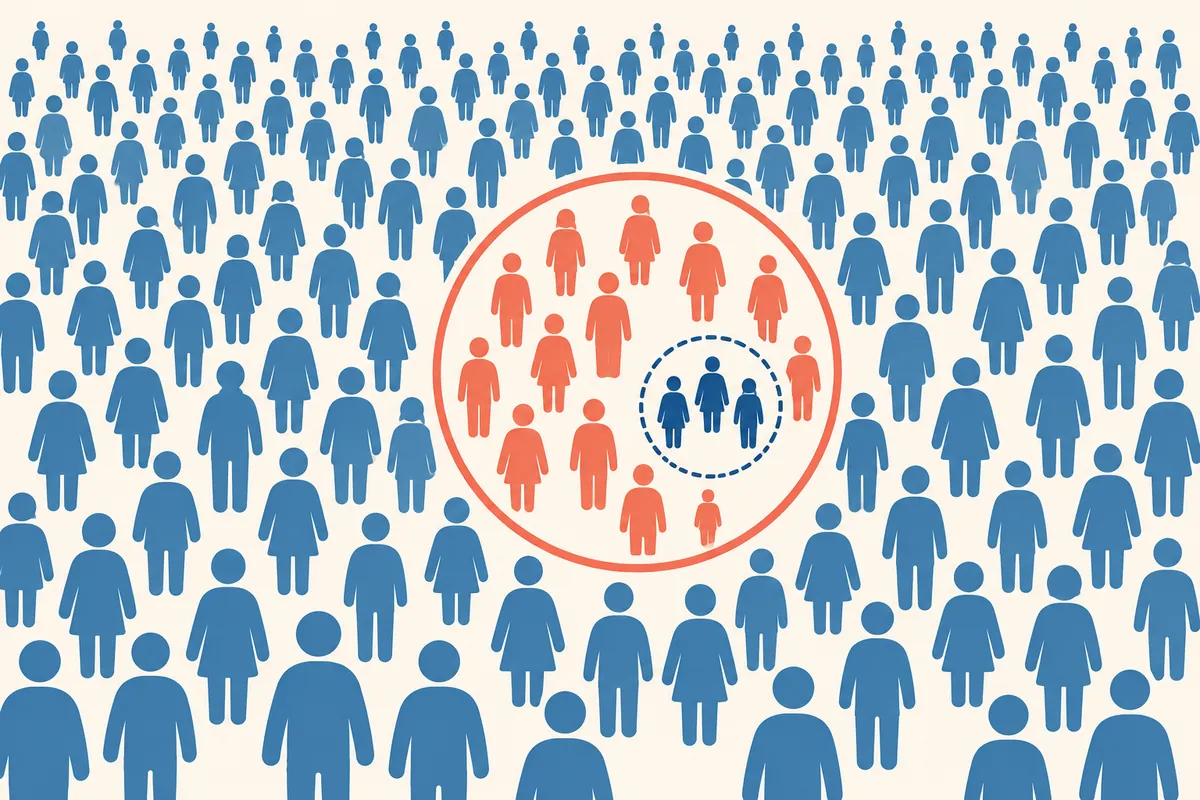
1. First, identify “whose opinion it is”
Adults nationwide, residents of specific cities, service subscribers, and participants in online bulletin boards are distinct subjects of a survey. Even if an article title is written as “The Public’s Thoughts,” the respondents in the body of the text may be users of a specific app. A large sample size does not automatically mean that the subjects of a survey represent the entire population. The population refers to the entire group intended to convey a conclusion, while the sample refers to the actual portion surveyed.
AAPOR Release Criteriaexplains that methodological information, such as the survey subject, recruitment method, questions, survey timing, sample size, and weights, should be disclosed. When applying this, it is recommended to look for the subject and recruitment method line by line in the original survey text rather than judging the title first. The comparison table and writing format below are reading tools provided in this article.
2. Items to Look for in the Article and the Reason
| item | Questions to check | Misunderstandings that arise when you miss it |
| Target Group | To whom are you trying to generalize? | Read subscriber opinions as total resident opinions |
| Sample size | How many people are actually included in this figure? | Apply the entire group to small groups as well |
| Recruitment Method | Is it a probability sample or voluntary participation? | Apply the same error formula to all surveys |
| Q&A Options | What exactly was asked | Equating other questions with similar expressions |
| Investigation period | Was the investigation conducted before or after which incident? | Directly compares values at different points in time |
| Error · Weight | What precision is included? | Read sampling error as total error guarantee |
If response rates are available in the data, check them as well, but do not automatically judge quality based solely on whether the numbers are low or high. It is necessary to know which groups were excluded from the response and how they were handled. Even for repeated surveys by the same organization, comparison conditions can change if the questions or recruitment methods are altered.
3. Sampling error is not the sum of all errors in the survey.
If you draw a sample again in a similar manner, the estimates will differ slightly. Sampling error is related to this sampling variation. A single number of ±3 does not solve all problems, such as questions leading to one-sided answers or certain people not participating in the survey.Pew Research Center Sampling Error Guidealso distinguishes between weights, non-sampling error, subgroups, and comparison uncertainty.
For example, if a library satisfaction survey targets only users inside the library, the complaints of residents who have not used the library for a long time may be missed. Even if a larger sample is collected, these differences in choice do not automatically disappear. Therefore, “having a large number of people” and “appropriately representing the target group” are different questions. This library example is an illustrative scenario, not an actual survey result.
4. An Accurate Perspective on Reading 95% Confidence Levels
In frequentist confidence intervals, 95% refers to the proportion of the interval generated by a method that includes the true value when sampling and interval calculation are repeated under the same conditions. This differs from simply stating that "the probability of the true value falling within this interval is exactly 95%" for an already calculated interval. A model and sampling assumptions are also required.
The reader's task in reading the article is not to recalculate all the statistics. First, check whether the confidence level and interval are specified, and whether they relate to the proportion of the entire sample or a specific subgroup. While a wide interval may suggest low precision in the estimation, the entire validity of the survey design cannot be evaluated based solely on the interval.
You should also avoid expressions like “the survey is 95% accurate because it is 95%.” This is because such statements fail to disclose the criteria used for accuracy. Whether the questions were properly measured, what the tendencies of non-respondents are, and whether the conditions for comparison with actual results are appropriate are separate matters to consider. When you come across a confidence level in the news, do not read that number like a guarantee; instead, look into the conditions of the calculation method.
5. Calculating Sample Size and Error as Virtual Numbers
Let us assume a simple random sample where responses are independent and the population is sufficiently large. By setting the standard error of the proportion p to approximately √[p(1-p)/n], we can calculate the 95% approximation error margin as 1.96 times. Since actual surveys require consideration of complex sampling, weights, sample sizes, and extreme proportions, this calculation is an example to help you understand the concepts in the article.
If p=0.5 and n=1,000, √(0.25/1,000) is approximately 0.01581, and multiplying by 1.96 gives approximately 0.03099. In percentage units, this is approximately ±3.10 percentage points. Increasing n to 4,000 reduces the error to approximately ±1.55 percentage points. Under these conditions, the sample size must be quadrupled to halve the margin of error. Doubling the number of people does not mean the error is halved.
If p=0.52 is applied under the same simple conditions, the approximate range is approximately 48.90% to 55.10%. Here, it is necessary to distinguish between adding and subtracting percentage points, rather than simply multiplying 52% by a relative ratio of ±3%. If an actual article indicates a range, read the range and calculation criteria reported in the survey first, rather than relying on an arbitrary formula. The numbers above are not actual public opinion data.
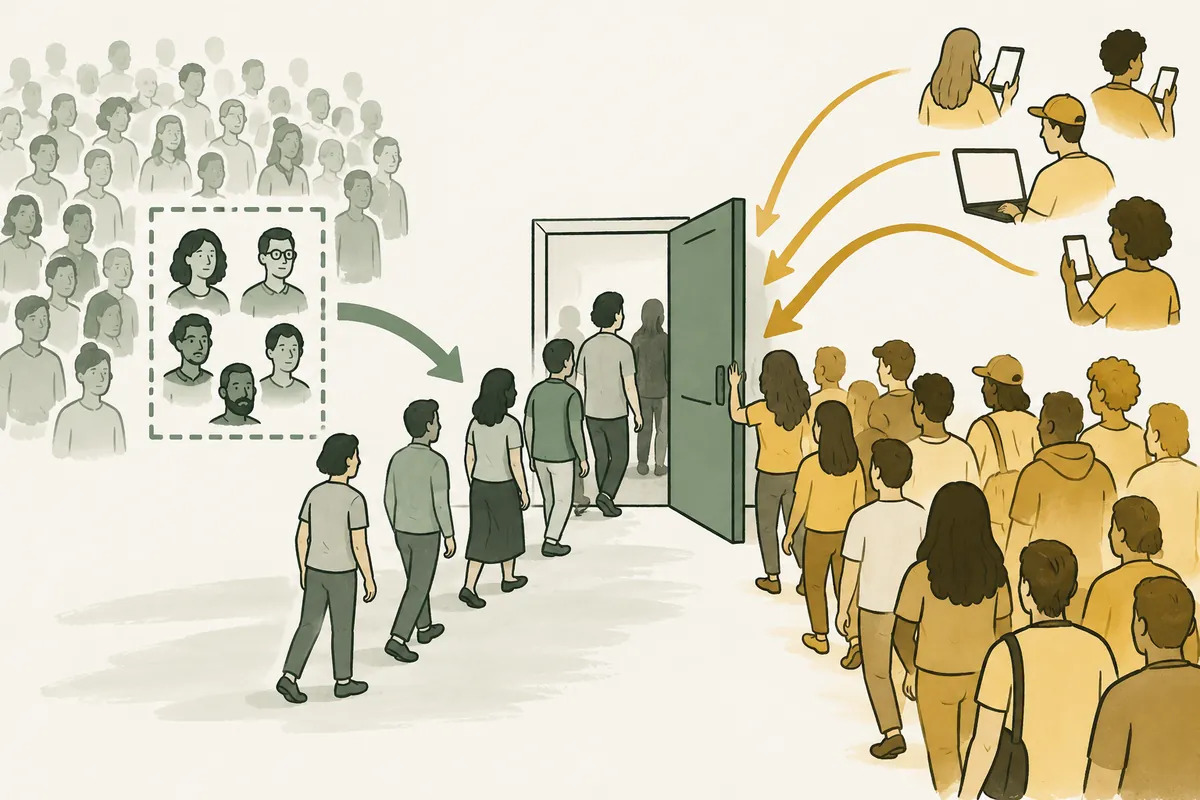
6. The whole sample and the small group sample are different.
Even if the total number of respondents is 1,000, there may be 100 respondents in a specific age group. Applying the margin of error listed for the whole directly to the figures for that age group can exaggerate the precision. Under the same simple assumption, if p=0.5 and n=100, the 95% approximation margin of error is ±9.8 percentage points. Please check the original survey text separately to see if the subgroup sample sizes and intervals are included.
In a virtual library survey, if overall satisfaction is 60% and satisfaction in a specific subgroup is 70%, the difference is 10 percentage points. However, if the subgroup sizes and designs differ, one cannot conclude that one group is definitely more satisfied based solely on the numbers. Analysis and uncertainty appropriate for the purpose of comparison are necessary. This confusion can be reduced by listing the total sample size, subgroup sample size, and reported error criteria on a single line.
7. We also examine the difference between the two items and the changes between the two time points separately.
Although the difference between 52% in favor and 48% against is 4 percentage points, the margin of error for a single proportion should not be used as the margin of error for the difference. Two response proportions from the same person may be related. The calculation of the difference between two survey points also varies depending on whether the samples are independent or if the same person was surveyed repeatedly. Furthermore, the observation that “two intervals overlap” alone cannot replace all difference tests.
The reader's next practical action is to verify the comparison conditions. List the question, response options, target audience, recruitment method, weights, and timeframe side by side. Do not interpret a slightly higher figure on one side as a definitive change when the conditions are different. If the actual survey report provides a difference test or trend analysis, read the results and limitations together. If there is no comparative analysis, you can note, "The displayed figures show a difference, but the uncertainty of change requires separate verification."
8. Distinguish between online voting and probability sampling.
Votes in which people voluntarily participate by clicking a link can provide useful opinions. However, you should not assume that this group of participants is the same as the entire user base.AAPOR Investigation Method Guideexplains that there can be probability and non-probability samples even in online methods. The survey design is not determined solely by the delivery method being online.
It may not be appropriate to simply plug the number of voluntary participants into a simple random sample formula and attach a plausible ± value. If precision figures are presented in a non-probability survey, you must verify which model and assumptions were used for the calculation. If there is no explanation of the method, it is accurate to interpret the figures as limited to the distribution of participant responses. The fact that "500 people clicked" is different from the claim that "the thoughts of the entire population were estimated with this error."
9. Memo to leave after reading an article
On a single page, list the survey agency, commissioning agency, survey date, target group, sample size, recruitment method, original questions, figures, and reported intervals. For items not found, mark “Unidentified” in the blank space. Do not fill in the fact that information is unavailable with desired assumptions. Since explanations of weights or design effects may be in a separate methods appendix, also check the reports linked in the main body of the article.
The final sentence separates the result from the interpretation. For example, you could write, “The indicated satisfaction rate of these survey respondents is 60%, and for the interpretation regarding the entire population, the recruitment method and ranges need to be further verified.” This is not an attitude of ignoring the results, but rather a method of preserving the scope indicated by the data. When reading numbers, looking at not only the sample size but also who was included and how allows you to become a more accurate reader.
10. Check percentages and percentage points at the end
If the virtual satisfaction changed from 40% to 44%, the difference is 4 percentage points, and the relative increase compared to the initial value is 4/40 × 100 = 10%. Since the two expressions represent different criteria for the same change, check what the article is saying. Verifying whether the original question is the same and whether the survey is comparable is separate from this calculation. We do not conclude that the actual change is certain simply because the relative increase can be calculated.
Official Sources and Writing Standards
Data Verification Date: 2026-10-09. This explanation was generated by AI based on actual official data. Calculations, codes, and verification examples marked separately are for illustrative purposes only and are not the results of direct testing or actual measurements of the user environment. We will re-verify whether there have been any changes to the functions and data on the publication date.
Original illustrations created to help explain this article.
Original on Tistory ↗