How to Choose Screen Resolution: Recommended Values and Actual Workspace
This article was translated from its source language with AI assistance. Please check technical terms and equations against the original.
Read resolution numbers and workspace together
A higher monitor resolution allows you to display more pixels on the screen. However, it is difficult to determine how many document windows you can fit based solely on that number. This is because Windows scaling and app layouts affect the actual usable space. This article focuses on understanding the recommended resolution and workspace for your current screen, rather than comparing options for purchasing a new monitor.
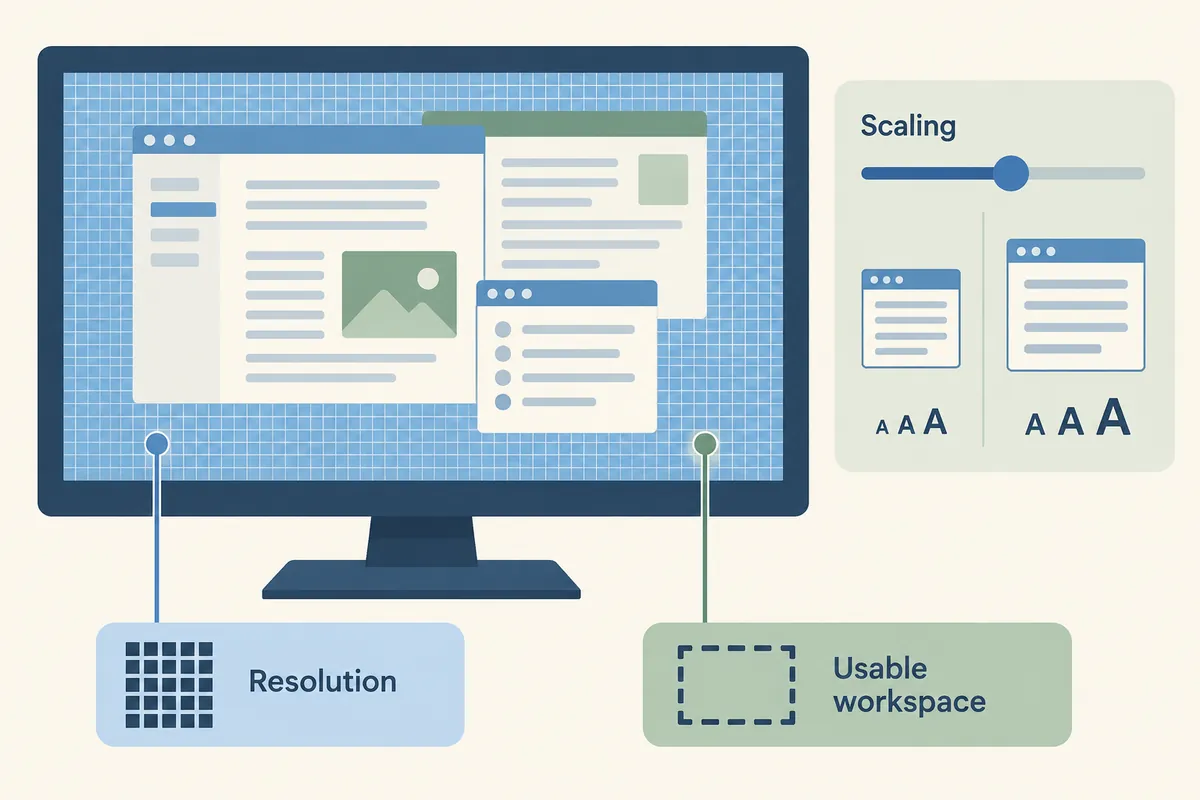
Resolution is expressed in terms of the number of pixels horizontally and vertically. A value of 1920×1080 means 1920 pixels horizontally and 1080 pixels vertically. Scaling is a setting that adjusts the display size of text and window elements. Since the results of lowering the resolution to make text larger may differ from changing the scaling at the same resolution, check them separately.
Microsoft's display guidelines generally advise maintaining the recommended resolution. Microsoft Learn's explanation of device-independent pixels helps distinguish between physical pixels and logical sizes based on scaling. The calculations below are a simplified model to help understand this concept and are not actual measurements of the display area of a real app. They do not include space such as the taskbar and window borders.
1. Select the screen you will actually change first
Select the screen to check in Settings → System → Display. If an external monitor is present, record the connection between the current screen number and the actual monitor location. Check the recommended values in the display resolution list for that screen and compare them with the current value. Just because there are many numbers in the list does not mean you must select the largest value.
It is recommended to include the monitor model and current connection method in the record. Even for the same screen, the output conditions may differ when connected via different ports or docking devices. If you change various values without remembering the current resolution, it is easy to lose the basis for reverting. Record the current resolution and scaling together and compare them one by one.
Do not copy the recommended values between the laptop's built-in screen and the external screen. The two screens may differ in physical size and pixel configuration. Read the information for the currently selected screen and actually open a document on it. It is also helpful to record whether you are using a duplicated screen or extending each screen, along with your workflow.
2. Calculate the number of pixels manually
For illustrative purposes, let's compare a 1920×1080 screen with a 2560×1440 screen. The number of pixels is 2,073,600 and 3,686,400, respectively. The second has approximately 1.78 times more pixels than the first. This is a comparison of pixel counts, not a direct comparison of font size or the number of available windows. You must also consider the scaling factor and the physical size of the screen.
| Output conditions for explanation | Simple calculation of logical size | Points to read |
| 1920×1080 / 100% | 1920×1080 | Size model with the same physical value |
| 2560×1440 / 100% | 2560×1440 | High logical workspace |
| 2560×1440 / 125% | 2048×1152 | Divide 2560 and 1440 by 1.25 |
| 3840×2160 / 200% | 1920×1080 | The number of pixels and the workspace are different |
3. Meaning and Limitations of Calculations Reflecting Scale
A simple calculation for understanding logical size involves dividing the number of physical pixels by the scaling ratio. Dividing 2560 by 1.25 yields 2048, and dividing 1440 by 1.25 yields 1152. Therefore, under the condition of 125%, the entire screen can be considered to have a logical size of approximately 2048 × 1152. This calculation is not a formula that guarantees the same number of windows for all apps on Windows.
In the example where 3840×2160 is used at 200%, dividing the two axes by 2 results in 1920×1080. Even if the logical size model is the same as when using 1920×1080 at 100%, the number of physical pixels is different. While this makes sense for situations where large text is displayed on a high-resolution screen, it does not mean that the text on the two screens actually appears to be the same size. The physical size of the screen and the viewing distance can also differ.
Actual apps differ in scaling, minimum window size, and toolbar placement. Even with the same logical width, some apps display two panels, while others allow one panel to be collapsed. Calculations are used only as a starting point for comparison, and the actual working file is opened for verification. This is why screen selection is not finalized solely by formulas.
4. Compare readable sizes in actual work
For example, if you are working with a document and reference materials side by side, check if the text is readable and the menu is cut off when the two windows are placed. It is more appropriate to create a work configuration that actually requires your needs rather than comparing full-screen numbers. Using the same document and the same in-app zoom level makes it easier to compare conditions.
Readers who primarily read tables can note how many necessary columns and rows are visible. Let’s set a hypothetical inspection goal: “Read the four columns of Name, Date, Amount, and Status without horizontal scrolling.” Verify if this is possible on the current screen, change the zoom level, and compare again. This goal is an illustrative example; actual user task requirements should be determined based on the necessary columns.
Even if the workspace is spacious, it can be difficult to continue writing if the text is too small. Conversely, if increasing the text size reduces the number of columns viewed at once while minimizing reading errors, that state may be more useful. Rather than evaluating the single criterion of "maximizing resolution," we evaluate text readability, window layout, and the simultaneous display of necessary information together. The comparison results are recorded in conjunction with actual usage conditions.
5. Differences visible when lowering the resolution
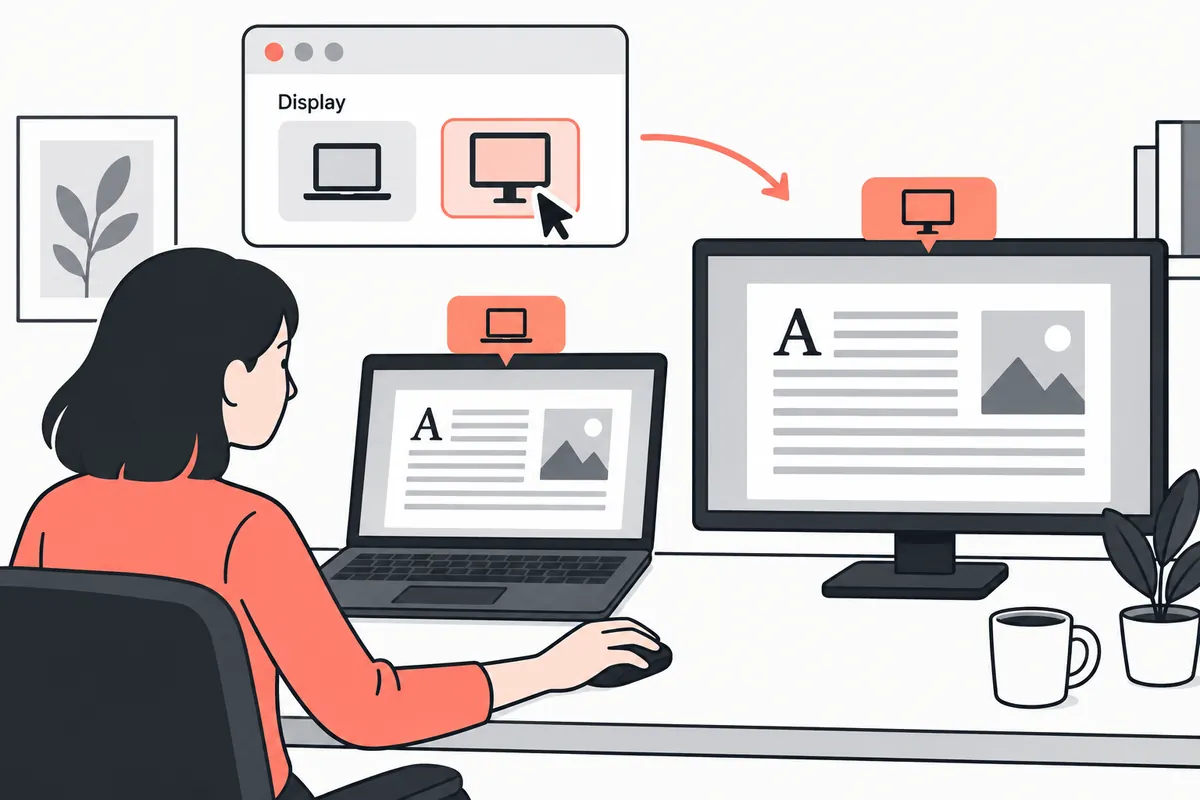
If you output at a resolution different from the monitor's original pixel arrangement, scaling may be required during the display process. Official support documentation explains cases where text appears less sharp, the screen stretches, or edges appear at lower resolutions. If you observe these changes, double-check the purpose to determine whether the action was taken for text size or for output conditions.
Let's consider a case where the text is too small on a virtual 2560×1440 screen, so we lower the resolution to 1920×1080. Even if the text size increases, the edges may look different. You can compare the results by returning to the recommended resolution and adjusting the scaling. You need to check the actual app and screen to determine which method is more comfortable, and we do not recommend specific numbers for all monitors.
When the change confirmation window appears, determine whether to read and maintain the display to see if it is displaying correctly. Do not repeatedly press the Maintain Changes button before verifying that the display is normal. Compare the supported values with the current values and return to the original record. When changing the resolution, focusing on checking the output status rather than modifying the document content can reduce mixing of conditions.
6. If recommended values disappear or suddenly change
If previously visible values have disappeared, first note the recently changed conditions. Check what has changed among the cable, port, docking device, number of connected screens, and system update. Rather than purchasing a new cable without knowing the monitor model and connection path, it is more helpful to identify the conditions under which it was previously used normally to narrow down the problem.
Microsoft's guidance explains that unexpected resolution changes may require a graphics driver update. However, this does not mean that all resolution issues are attributed to a single driver. Refer to the check items in Windows Update and the actual model guidelines from PC and monitor manufacturers, and record the values that appear after making changes. Do not rely on arbitrary driver download sites as the basis for verification.
It also distinguishes whether the resolution setting is being viewed within the remote connection screen. The local monitor and the remote environment may not have the same display conditions. Recording which PC's settings are being changed and whether the local screen is functioning correctly can reduce the likelihood of modifying settings for the wrong device. Unverified remote output conditions are not read as the physical performance of the local monitor.
7. Do not mix resolution, refresh rate, and window zoom
Resolution refers to the number of pixels, and refresh rate refers to how often the screen is updated. The zoom level in a document app refers to the viewing size of the content. While these three values affect the screen experience together, they are not the same item. Changing the refresh rate because the document is too small, or altering the text zoom level because the movement is choppy, may result in a mismatch between your goals and actions.
In the example check, first verify the recommended resolution, compare the screen scale, and record the document's magnification in a separate column. Changing one value at a time makes it easier to link the desired result with the side effects. It is helpful to write it like “Resolution maintained, scale only changed, menu size became more convenient but two more columns in the table are hidden” rather than “Improved after change.”
If you use the same task for a long time, save the task configuration compared to the final value. As toolbars expand after an app update, the required space may change even on the same screen. Rather than unconditionally maintaining previous settings, record them so you can re-verify the actual task criteria. Screen configuration is not a competition of numbers, but the task of establishing conditions to read and handle necessary information.
8. Four things to check before applying
Verify whether the target screen is correct, what the current recommended resolution is, what the scale and app zoom levels are respectively, and whether the window placement required for actual work is possible. If simple logical size calculations were performed, note the limitations, such as the assumption that they were divided by the scale and that borders and the taskbar were excluded. Do not present numerical models as performance results without actual captures or measurements.
Virtual recording can be written like this: “Planning to compare scales of 125% and 150% at the recommended resolution of the external screen. Verify that four columns of the same table file are read simultaneously and save the current values.” If not yet performed, keep the indication that it is planned. The calculations and tables in this article explain the verification method and do not replace the user's screen testing.
When reading resolution numbers, considering the workspace based on pixel count and scaling together makes it easier to determine the purpose of the settings. Start with the recommended values, compare the required font size and window configuration, and record the final state. This allows you to continue checking using the same criteria the next time the connection method changes or the screen looks unfamiliar.
Official Sources and Writing Standards
- Microsoft: Change your screen resolution and layout
- Microsoft Learn: DPI and device-independent pixels
Data Verification Date: 2026-10-09. This explanation was generated by AI based on actual official data. Calculations, codes, and verification examples marked separately are for illustrative purposes only and are not the results of direct testing or actual measurements of the user environment. We will re-verify whether there have been any changes to the functions and data on the publication date.
Original illustrations created to help explain this article.
Original on Tistory ↗