Reading Contour Lines: Three Things to Check Before Counting Lines
This article was translated from its source language with AI assistance. Please check technical terms and equations against the original.
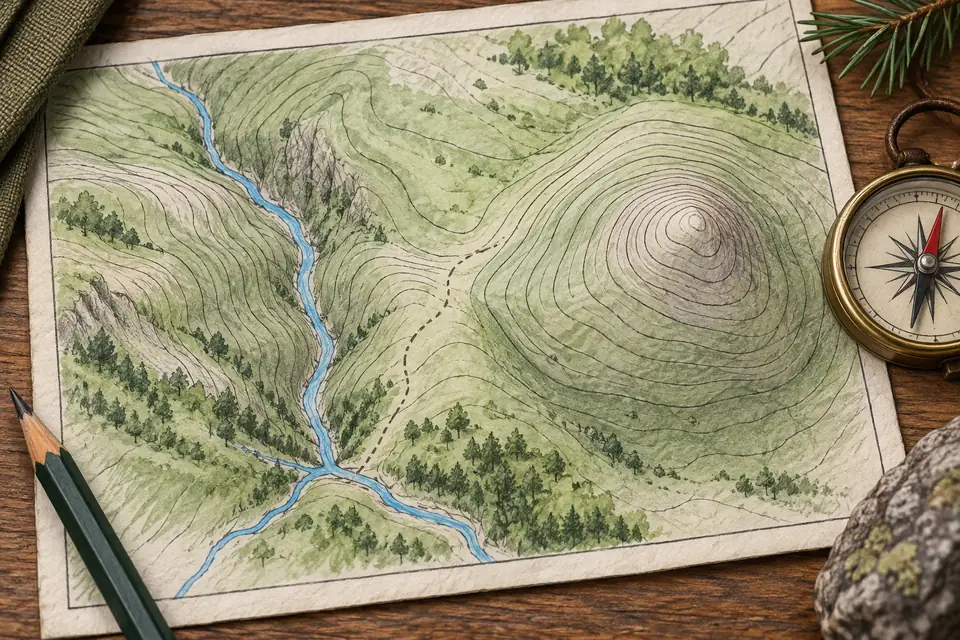
A first encounter with a dense contour map can make its brown lines look like paths. They are not walking routes, but lines joining points of equal elevation. Before turning them into a mental landscape, check the reference elevations, contour interval, and scale. Missing these can change your slope interpretation even if you count the lines correctly.
1. Read elevation units and the contour interval first
USGS's topographic-map explanation describes contours as a key way to depict terrain shape and height. Use a labeled line to read neighboring elevations, but first check whether the legend uses meters or feet. Do not automatically interpret unfamiliar or older maps in your usual units.
The contour interval is the elevation difference between neighboring contours. On an imaginary map, 120 m and 140 m lines between 100 m and 160 m mean a 20 m interval and a 60 m elevation change. There are four lines including both endpoints, but three intervals. This avoids counting only labeled lines or multiplying the interval by the total number of lines.
2. Close lines indicate a steep slope
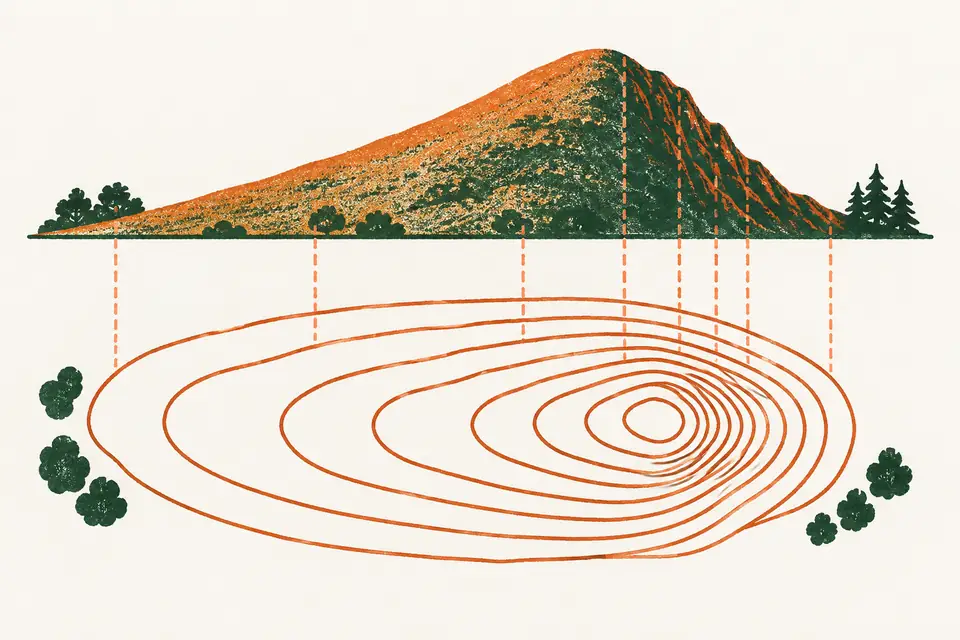
With the same scale and contour interval, closer lines mean more elevation change over a short horizontal distance; widely separated lines mean a gentler change. USGS's map-planning guide explains this relationship. Comparing density across maps with different contour intervals can mislead, so match conditions first.
If the horizontal distance between the imaginary 100 m and 160 m points is 500 m, average grade is 60 ÷ 500 × 100 = 12%. This is a calculation example, not a field measurement. Twelve percent is not twelve degrees. It is an average between two points, not a claim that every intervening segment has that slope. Separate grade from angle and average from local slope.
3. Connect scale to horizontal distance
At 1:25,000 scale, 1 cm on the map represents 250 m horizontally on the ground, so 2 cm represents 500 m. Draw the example's 100 m and 160 m points 2 cm apart to connect numbers to a diagram. If you zoom a digital map, use its current scale bar or distance tool rather than treating screen length as an unchanged paper measurement.
A straight map distance differs from the length of a winding walking route. Distance following changes in terrain height also differs from horizontal distance. Decide first whether you are calculating average slope between two points or estimating route length, then select the appropriate distance. One kind of distance cannot explain every aspect of a journey.
4. Use labels to distinguish hills from depressions
Nested closed curves do not always represent a summit. Check whether elevations rise or fall inward, and look in the legend for depression symbols. You cannot invent an exact summit elevation in an unlabeled center. Without a spot elevation or additional information, avoid conclusions beyond what the contour information supports.
For practice, mark a small map area with separate symbols for low ground, high ground, and rapid elevation change. Then reread its numbers and legend to check your first interpretation. Marking the evidence matters more than memorizing shapes. A map compresses terrain information; do not assume it includes every small obstacle or the actual condition of a route.
Original illustrations created to help explain this article.