The Difference Between Press Releases and Papers: Checking the Claims, Conditions, and Evidence of Science News
This article was translated from its source language with AI assistance. Please check technical terms and equations against the original.
You might read a science news report stating that “new technology doubled performance,” but the paper might describe it as a small experiment conducted under specific conditions. If the test subjects and conditions are omitted during the process of summarizing news for easier understanding, readers tend to interpret the scope of the results broadly. Since press releases and academic papers differ in their audiences and purposes, their sentence structures do not need to be identical. However, details regarding what was actually tested and the extent of verification must be preserved. This article explains a practical method for comparing claims by moving from a news article to the original paper.
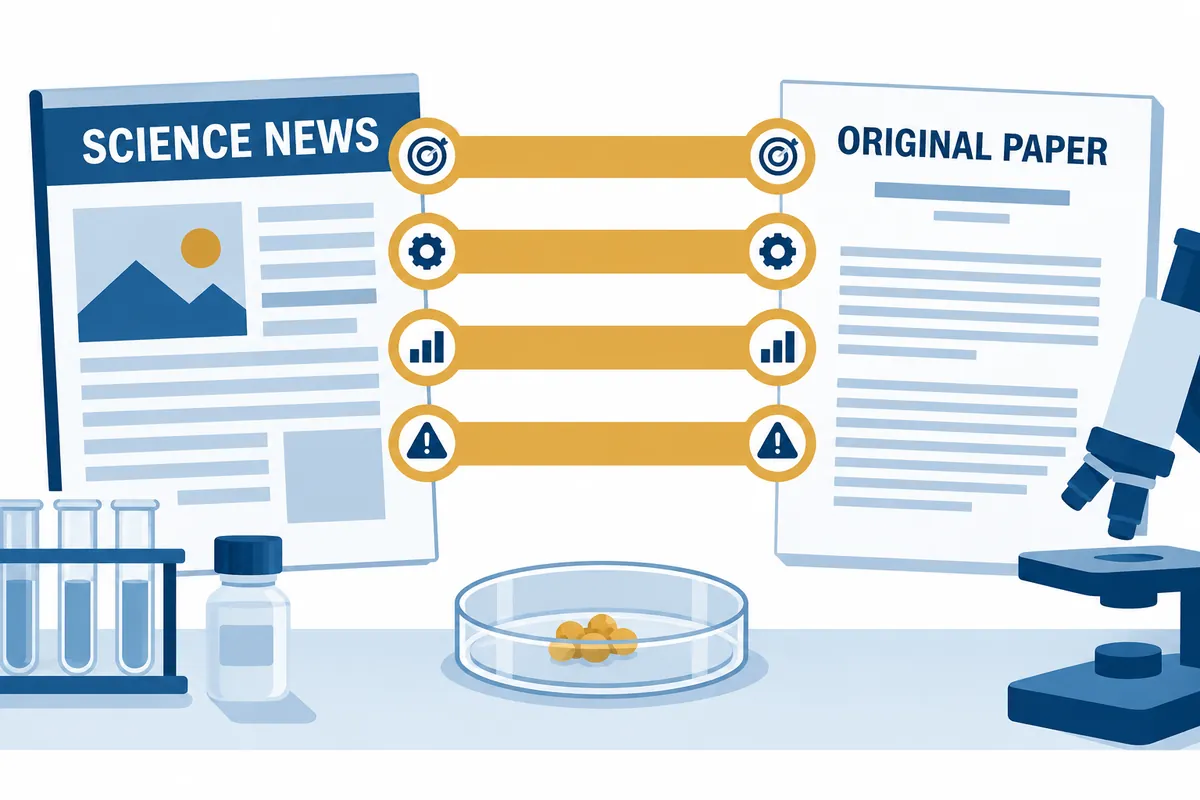
1. Using press releases as a starting point to locate the original paper
Press releases often include information on research institutions, researchers, publication dates, and links to journals and papers. The first step is to list identifying information such as the paper title, authors, publication year, and DOI. Finding other papers on the same topic does not mean that the source material for the original article has been verified. After verifying that the paper title and authors match, read the abstract and methodology.
While a DOI helps distinguish papers, the mere fact that a DOI exists does not validate the truth of the results. Check the publisher's text, revision notices, and the research materials and supplementary explanations as necessary. If only the free abstract is visible and the method cannot be read, limit the scope of verification to the abstract. Do not fill in the text by assuming that test conditions exist in the unopened body.
2. Reasons why it is difficult to definitively believe the wording in the press release
Sumner et al.'s 2014 BMJ papercompared 462 health and biomedical press releases from 20 UK universities with linked papers and news in 2011. The study investigated the reinforcement of behavioral recommendations, changes in expressing correlations as causation, and expressions extending non-human research to humans, and reported a correlation between the exaggeration in press releases and news.
Translating these results into “all press releases are exaggerated” or “what percentage of current news is false” goes beyond the scope of the original study. This is because the results pertain to a specific time period, field, institution, and analysis method. Here, the study figures are not applied as probabilities for the entirety of current news, but are used as clues to identify what sentence changes occur. The hypothetical technical examples and reading styles below are not copies of the study data but are newly constructed explanations.
3. The fastest comparison is to divide the argument into four sections.
| cell to compare | Find in press release | to find in the paper |
| target | Scope introduced by people, materials, and devices | Actual Participants · Specimens · Test Devices |
| condition | When and where is it said to be effective? | Temperature · Period · Load · Comparison Criteria |
| result | Key numbers and units showing improvement | Measured Value · Comparison Value · Uncertainty |
| Limit | Development Phases and Remaining Tasks | Method Constraints · Generalization · Additional Research |
After filling in the table, examine the blanks. You do not immediately judge a press release to be incorrect simply because it does not mention the test temperature. However, you must check the original conditions to avoid reading it as if it were “effective in any environment.” An evaluation that the results are interesting and a claim that practicality has already been proven are at different stages.
4. Five things to look for when moving from green to method
First is the test subject. Distinguish whether it is a human subject, a cell or animal, or a specific alloy specimen. Second is the comparison subject. Determine whether it was compared directly with an existing product, with a control group, or with a computational model. Third is the measurement indicator. Record what was measured and in what quantities, such as success rate, energy, time, and intensity.
The fourth point concerns the number of tests and the number of data points. Values taken multiple times from a single specimen are not treated as the results of multiple independent specimens. The fifth point concerns conditions and scope. Results obtained from a fixed laboratory temperature or a small data set are not directly applied to the entire actual field. If detailed methods are available in supplementary materials outside the main text, locate and read the linked file.
When understanding the reporting items of observational studiesSTROBE Official ChecklistYou may refer to . However, since this is a standard for reporting observational studies, it is not a pass/fail table applicable to all materials experiments or engineering papers. You must select data and comparison criteria appropriate for your field.
5. Distinguishing Correlation, Causation, and Applicability in Sentences
There is a difference between observing that a characteristic and a result appear together and making a causal claim that the characteristic produced the result. For example, one cannot conclude that app usage raised work scores based solely on hypothetical data showing that people who frequently use a particular app have higher scores. The selection process may also be related to other factors, such as original work habits or education level.
Even for experiments, you must verify what actual manipulations and comparisons were made. Check whether randomization occurred, whether conditions were consistent, and how the subjects were selected, and follow the scope presented in the study. When it states that results obtained from non-human subjects are applied to humans, also read to see if additional research is required in between. This article does not recommend specific health behaviors, but explains how to interpret the scope of research expressions.
The stages “did potential,” “observed,” “improved under experimental conditions,” and “field application completed” are distinct. Please preserve these verbs when summarizing. If you replace future expectations with currently verified results, or describe proposed principles like the performance of commercial products, it becomes stronger than the level stated in the original text.
6. Virtual materials experiment that doubles performance
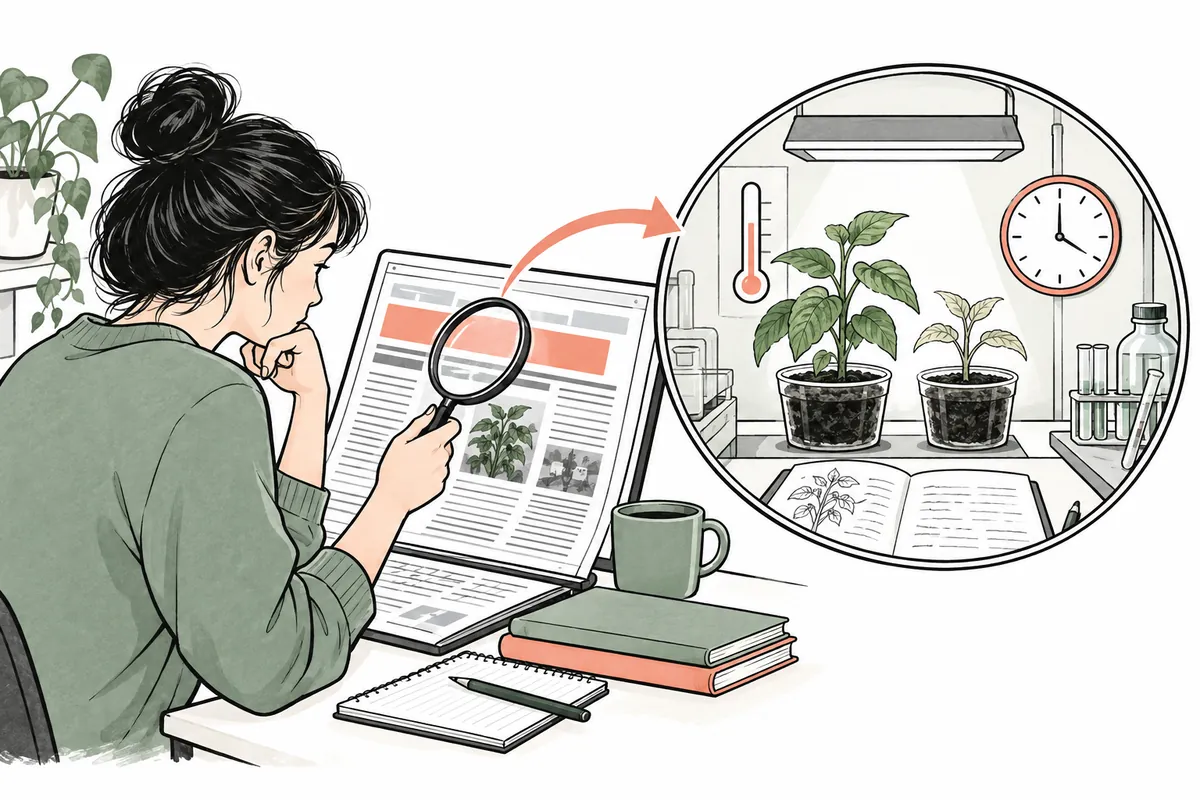
For illustrative purposes, let's assume a test where the average lifespan of the existing specimen is 10 hours and the new specimen is 20 hours. Under the same conditions, the ratio is 20/10=2, and the relative increase is (20-10)/10×100=100%. "Doubling" and "100% increase" represent the same change based on this standard. However, stating that the value of the new specimen is 200% of the reference value is different from stating that it is a 200% increase. First, indicate which number is the reference.
Let’s add the additional assumption that there were three specimens in each of the two groups and that they were compared at only one test temperature. With this information, it is appropriate to limit the summary to “average life doubled under assumed conditions.” The conclusion that the life of mass-produced products doubled across all temperatures and loads was not confirmed in this example. Furthermore, without the dispersion of values and actual analysis results, one cannot add that there is a statistically definite difference.
This number is not a measurement taken directly from the paper. It is a calculation intended to demonstrate that the key figures in an article must be linked to the standards, conditions, and number of data points. When reading an actual paper, one checks the units, comparison groups, and the meaning of error bars in the original tables and does not mix in any separate assumptions.
7. Order of reading axes and error bars on a graph
Do not rely solely on the graph title; write down the names and units of the horizontal and vertical axes first. Even the same difference in height can appear different depending on the axis range. While not all graphs where the vertical axis does not start at 0 are incorrect, you must check the reference and scale when reading the magnitude of change. Also, distinguish whether it is a logarithmic or linear axis as indicated in the data.
Error bars can represent various meanings, such as standard deviation, standard error, or confidence interval. Do not automatically interpret them as a 95% interval simply because the bars have length. Please look up the definition and sample size in the figure description. In particular, repeated measurements and the distinction between different specimens are important for interpretation in materials testing. If you cannot find the legend, defer interpretation and record it as “Bar definition unconfirmed.”
When recreating explanatory figures, the meaning must be preserved. Do not create plausible distributions or trend lines and present them as results from the original paper when actual values are unavailable. If it is a process diagram, specify the verification sequence; if it is a hypothetical calculation, indicate "example" next to the numbers. A clean design is separate from having verified evidence.
8. A record to leave when the original text is unavailable or the wording is different
If the main text cannot be accessed, record the paper title, journal, DOI, and the range of verifiable abstracts. Do not state that tables or supplementary materials were verified based solely on a single sentence found in the search results. While it is possible to find out if the institution provides a separate research introduction, distinguish that introduction from reading the main text directly. If the article lacks information identifying the original paper, search for materials using the institution, researcher, and publication date as clues; if the correct paper is still not identified, leave this as a limitation.
If the wording differs, first specify exactly which part it is. Write it like this: “The news describes it as a therapeutic effect on humans, but the subject of the paper abstract is animals,” or “The institution introduction anticipates commercialization, but the paper describes small-scale laboratory results.” Do not assume the author’s intent simply because you have discovered a difference in the data. Simply placing the verified sentences alongside the missing conditions is helpful to the reader.
9. Five sentences to write directly in a blog summary
Write the research question in the first sentence. In the second, list the actual subjects and comparison conditions. In the third, explain the key results using reference values and units. In the fourth, list the scope of application of the results and any parts that have not yet been verified. In the fifth, attach links to the original paper and press release, along with the date the materials were verified. This template is useful for conveying the content of the research rather than using exclamations or exaggerations.
The summary of a hypothetical example can be written as follows: “We assumed a test comparing the lifespan of two materials at a specific temperature. The average values of the three specimens in each group were set to 10 hours and 20 hours. The average ratio is double. Since dispersion, statistical differences, and other environments are not given, the conclusion is not extended.” In an actual paper summary, you must include the conditions of the material actually read instead of this hypothetical sentence.
Before sharing, please verify that the subjects have not changed, that correlations have not been converted to causation, that expressions of multiples without a standard have not been used, and that expectations have not been shifted to completed applications. Since papers can be revised or interpreted differently due to follow-up research, please re-check the linked materials and relevant notices on the publication date. What readers can do now is not to exaggerate the results, but to accurately convey verifiable conditions.
Official Sources and Writing Standards
- Sumner et al. BMJ 2014 original paper, Cardiff Repository
- STROBE Observational Study Formula Checklist
- STROBE Official Checklist List
Data Verification Date: 2026-10-09. This explanation was generated by AI based on actual official data. Calculations, codes, and verification examples marked separately are for illustrative purposes only and are not the results of direct testing or actual measurements of the user environment. We will re-verify whether there have been any changes to the functions and data on the publication date.
Original illustrations created to help explain this article.
Original on Tistory ↗