Correlation Versus Causation: Questions to Ask in Science News
This article was translated from its source language with AI assistance. Please check technical terms and equations against the original.
Suppose a science article states that students who studied longer scored higher. Saying that two quantities varied together differs from claiming that increasing study time raises everyone's score by the same amount. Separate what was observed from what is claimed as a cause when reading such relationships.
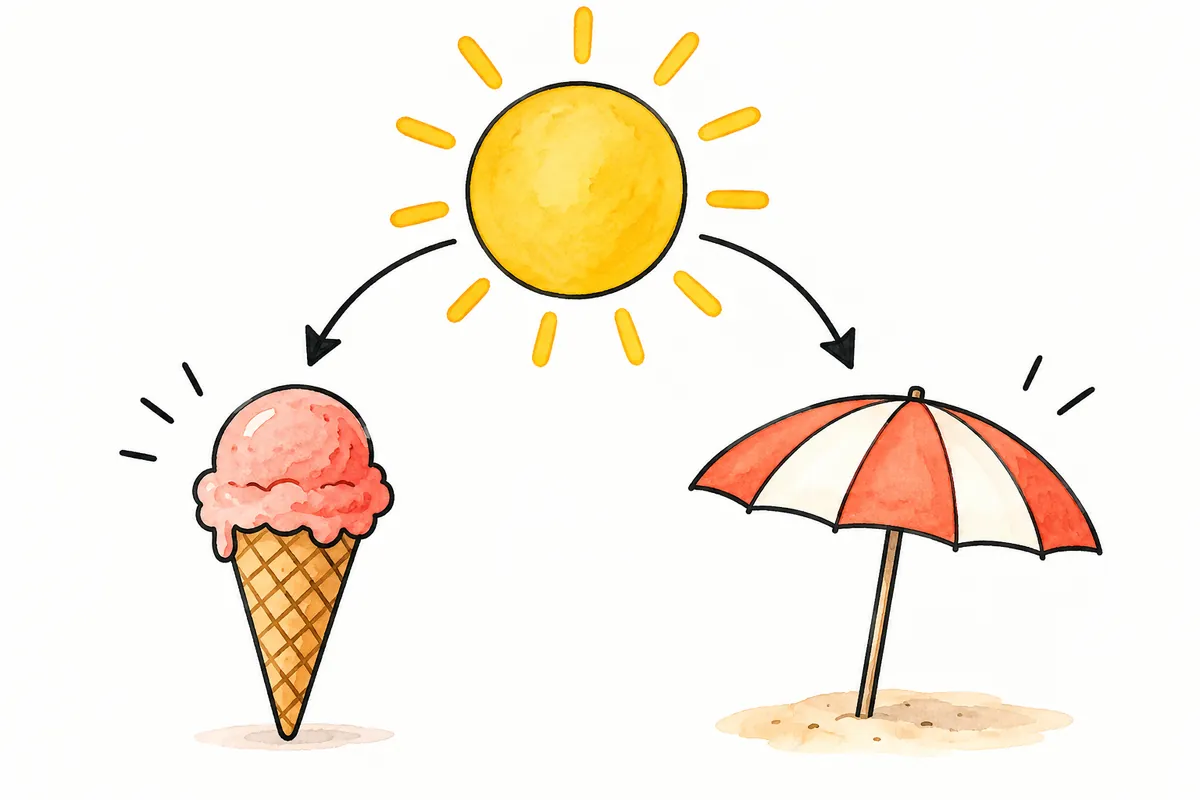
This article explains basic questions for reading research findings. The students, textbooks, and scores below are original hypothetical illustrations, not results of surveying actual students or measuring educational effects. Do not use them to recommend a particular product or behavior's effects.
Four questions for reading relationships in science articles at a glance
Explanatory illustration — not an actual screen or test result.
1. Identify variables that changed together
2. Compare the timing of candidate causes and outcomes
3. Check comparison groups' starting conditions
4. Examine other factors that changed alongside them
5. Distinguish observed results from the scope of causal claims
1. Separate “changed together” from “caused a change”
The Australian Bureau of Statistics explains that correlation can indicate a relationship's direction and magnitude but does not automatically mean one variable causes another. NIST likewise distinguishes correlation from causation and explains that third factors can produce relationships. Finding a relationship is useful for forming research questions, but causal judgments require separate evidence.
Even if hypothetical students with longer study times have higher mean scores, the process producing that difference may remain unknown. Ask whether prior knowledge, classroom participation, and homework also differed. Proposing these possibilities differs from confirming that such factors actually caused the outcome.
| Statement | Claim type | Further verification |
| Students with longer study times scored higher | Observed relationship | Population and measurement method |
| Increasing study time raised scores | Causal claim | Comparison design and other factors |
| The same effect for every student | Expanded applicability | Evidence outside the studied population |
| Related factors remain unverified | Remaining uncertainty | Which information is missing? |
Compare headline verbs such as “raises” and “reduces” with “was associated with” or “was observed” in the body. A headline can imply causation while the research description remains observational. Judge the actual comparison performed rather than stronger headline wording.
2. Check whose data were obtained and how
Find the population, collection period, and measurement methods. Scores from different tests may not be directly comparable, and differently recorded study time can have different meanings. Interpretation needs details such as whether time was measured directly or recalled by respondents.
If hypothetical data include only participants in one course, extending results to all ages and learning environments requires additional evidence. First establish which group the mean summarizes. Even a large participant count leaves important questions about who was excluded and under what conditions collection occurred.
Check the comparison unit when reading that two things are related. Student-level scores and school-level average scores are different analyses. Read whether each table row or graph point represents an individual or a group, so group-average relationships are not directly imposed on every student.
3. Did the candidate cause precede the outcome?
Evaluating a causal explanation requires temporal order. Were scores measured after increased study time, or were time and scores surveyed at the same moment? Check whether the article considers choices changing after the outcome occurred.
Imagine that high-scoring students in a hypothetical survey gained confidence and increased their study time. This is a thought experiment exploring another explanation, not confirmed behavior of actual students. If one simultaneous survey cannot establish temporal order, retain that limitation.
Measuring a candidate cause first does not resolve every causal issue. Earlier conditions may influence both quantities. Timing is one checking question; it cannot replace questions about comparison groups and other factors.
4. A third factor can change both quantities
Suppose students in a hypothetical school spend different amounts of time participating in class, and those participating longer also do more homework and personal study. Ask whether classroom participation differences were considered when examining study-time/score relationships. Confirm which factors were actually addressed in the methods and analysis.
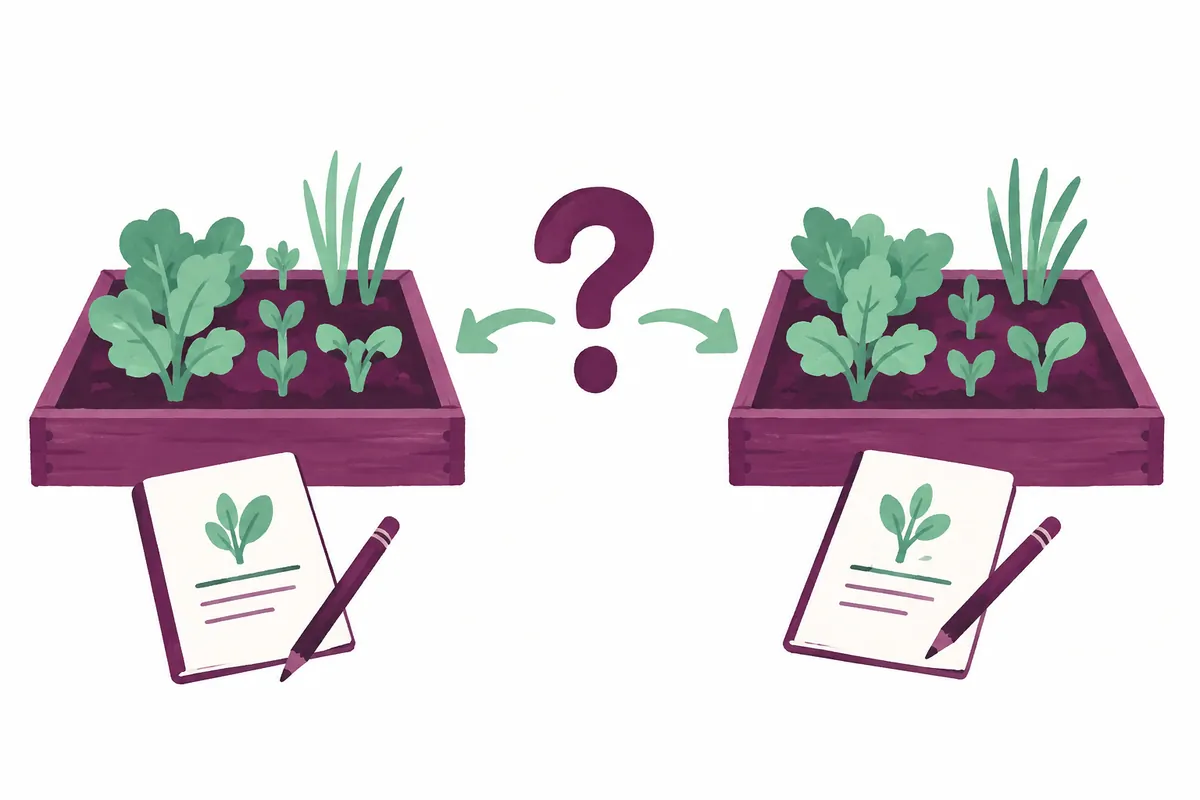
Do not use “other factors may exist” to dismiss every result. Read specifically which alternatives were examined and which information remains missing. How relevant factors were measured and adjusted matters more than arbitrarily listing many possible third variables.
Even when an analysis says it adjusted for multiple factors, check what was included. Unmeasured conditions, imperfect measurement, and researcher-stated limitations can remain. If a news summary says “all factors were controlled,” compare that scope with the actual methods.
5. Calculate an illustrative mean difference
Call two hypothetical groups A and B and list four students' scores in each. These values illustrate arithmetic, not actual education research. We specify only that A studied longer and provide neither random assignment nor prior-score information.
| Hypothetical group | Example scores | Mean |
| A | 70, 80, 80, 90 | 80 |
| B | 60, 70, 70, 80 | 70 |
| Difference | 80 − 70 | 10 points |
A's mean is 320 divided by 4, or 80; B's is 280 divided by 4, or 70. The observed mean difference is 10 points. This calculation cannot establish that increased study time caused a 10-point effect, because starting conditions and other factors were not given.
Individual time values are absent, so this is not a calculated correlation coefficient either. Comparing means, computing correlations, and estimating causes are different tasks. Numbers in a table do not justify adding an analysis not performed; write only statements directly supported by the supplied data.
6. Check what a comparison study actually changed
The Australian Bureau of Statistics describes controlled studies giving different treatments to comparable groups and evaluating outcomes. NIST connects exploring causal relationships with designed experiments. Applied to news, ask whether groups were merely labeled separately or whether conditions were actually assigned or changed.
For a hypothetical textbook study, determine whether students chose new or old textbooks themselves, or the study specified assignment. Different selection reasons can mean different starting points, requiring information explaining the comparison. If “random” appears, read what was randomized.
Even a well-designed comparison must be interpreted within its population and period. Observational studies are not always useless, and the word “experiment” does not settle every causal claim. Examine researchers' assumptions and connections to other evidence.
7. Preserve effect magnitude and scope in news summaries
The American Statistical Association's p-value guidance explains that statistical significance does not measure effect size or importance. If a result is described as statistically significant, read its magnitude and uncertainty too. Do not equate significance with the size of an actual difference. Stating which measure changed, by how much, and under what conditions lets readers judge practical meaning.
For the example's 10-point difference, “the means of two hypothetical groups differed by 10 points” matches the calculation. “This method raises scores by 10 points” requires causal evidence not provided. Changing the explanatory verb alone can change a claim's strength.
Retain essential scope even when shortening uncertainty or conditions. If the population is one course, that condition must remain. Do not introduce unsupported long-term effects, cost effectiveness, or outcomes for other ages into illustrations or conclusions.
8. Questions readers can use immediately
On a one-page note, ask “Who was studied? How were both quantities measured? What was compared? What temporal order exists? How were alternatives handled? What are the magnitude and scope of the result?” Seek unanswered fields in the original study's methods and limitations.
If the original cannot be found, separate reported facts from unverified interpretations. Reading only a press release does not mean reviewing detailed research analysis. Unsettled causation does not erase the relationship itself, so preserve confirmed findings at their actual evidential strength.
The illustrations show questions about relationships, timing, comparison conditions, and third factors. They are not graphs estimating or validating an actual causal pathway. Separating observations from causal claims preserves interesting findings while showing readers what needs further confirmation.
Official sources and writing standards
- Australian Bureau of Statistics: Correlation and causation
- NIST: Experiments and Experimental Design
- American Statistical Association: Statement on Statistical Significance and P-Values
References checked: 2026-10-07. This explanation was written with AI assistance based on official sources actually opened. Separately marked calculations, code, and checking examples are illustrative, not results from directly testing or measuring the user environment. Recheck changes to features and references on the publication date.
Original illustrations created to help explain this article.
Original on Tistory ↗