Percent Versus Percentage Points: Calculating Changes in News Reports
This article was translated from its source language with AI assistance. Please check technical terms and equations against the original.
When a rate changes from 20% to 25%, “increased by 5%” differs from “increased by 5 percentage points.” Calculation depends on whether it expresses a difference or relative change from the original. Writing old and new values makes this clearer than memorizing symbols alone.
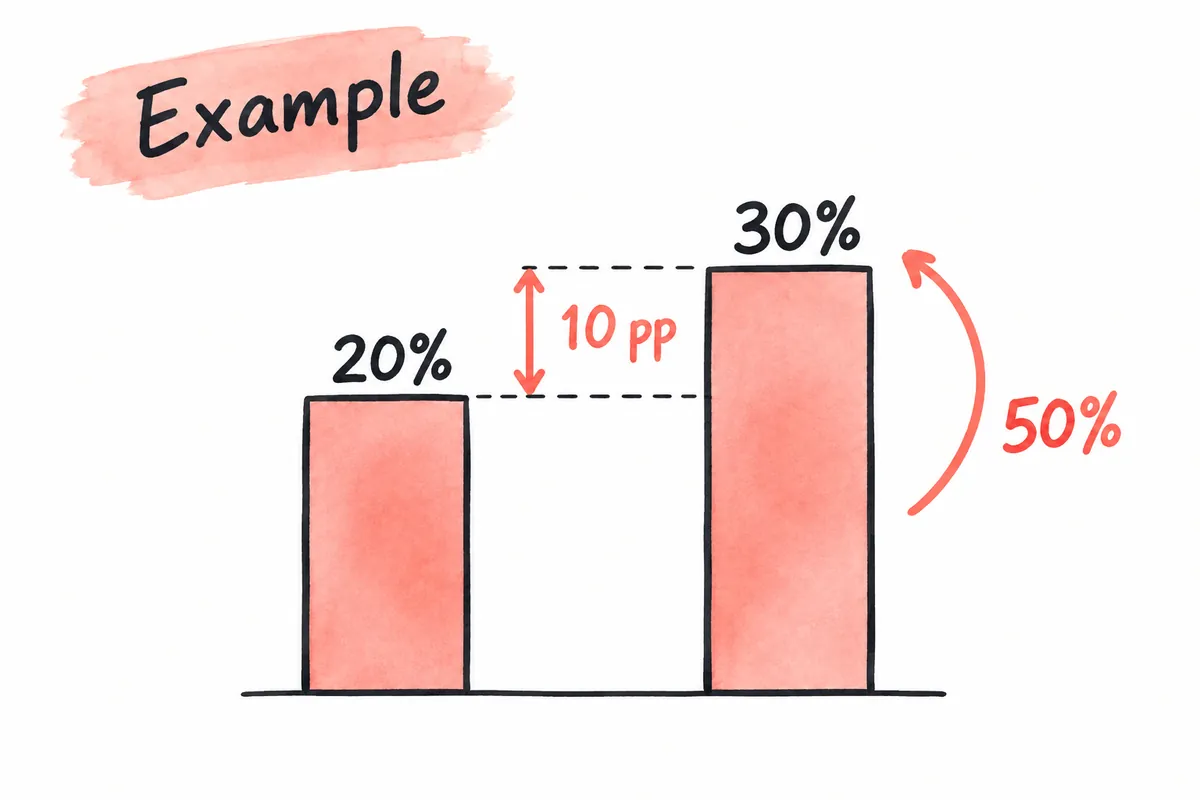
This article explains calculations for statistical statements. Participation and test-pass rates are original hypothetical examples, not institutional or experimental results. It evaluates no product, investment, or treatment effect. Definitions from official statistical institutions inform the calculations and writing methods.
Two readings of a hypothetical rate: 20% → 25%
Difference in rates · 25 - 20 · Increase of 5 percentage points
Change from the original · (25 - 20) / 20 × 100 · Increase of 25%
Reverse-direction change · (20 - 25) / 25 × 100 · Decrease of 20%
1. Percent expresses a proportion; percentage points express a difference between proportions
Percent compares a quantity with its total on a base of 100. For 40 out of 200, divide 40 by 200 and multiply by 100 to get 20%. Percentage points express the difference between two percentages. Eurostat and the UK's statistics guidance distinguish these too.
From 20% to 25%, the percentage-point change is 25 minus 20, or 5. Relative change is that difference divided by 20 and multiplied by 100, or 25%. They answer different questions; neither automatically makes the other incorrect. State which change you mean.
퍼센트포인트 변화 = 새 비율(%) - 원래 비율(%)
상대 변화율(%) = (새 값 - 원래 값) / 원래 값 × 100
Use consistent representations in formulas. Mixing 20 with 0.25 for 20% and 25% uses different scales. Relative change can use 20 and 25 or 0.20 and 0.25, but percentage points describe the difference on the percent scale.
2. Write two statements for the same change
Suppose eligible participants number 200 in both hypothetical periods, and participation grows from 40 to 50. The rate moves from 20% to 25%, a difference of 5 percentage points. Relative participant-count change is 10÷40×100=25%. The unchanged total makes both relative changes equal here.
| Illustrative question | Calculation | Result statement |
| Difference in participation rates? | 25 - 20 | Increase of 5 percentage points |
| Change relative to the original participation rate? | 5 / 20 × 100 | Increase of 25% |
| Difference in participant count? | 50 - 40 | Increase of 10 people |
| Relative participant-count change? | 10 / 40 × 100 | Increase of 25% |
Writing “the participation rate rose from 20% to 25%, or 5 percentage points” lets readers recalculate. “Increased by 25%” alone can be mistaken for reaching 25%, so identify what changed relatively.
3. Changing totals can move rates and counts in different directions
In another hypothetical example, 20 of 100 participate initially and 30 of 200 later. Participant count grows 50% from 20 to 30, but the rate falls from 20% to 15%. Its difference is −5 percentage points and relative change −25%.
“Participation increased” and “the participation rate fell” can both be true because totals changed. Distinguish numerator-only statements from ratios including denominators. For seemingly contradictory numbers, inspect comparison bases before correcting arithmetic.
Write counts alongside rates and check population changes. If the first denominator is eligible people and the second actual applicants, they may not represent the same indicator. Even matching rate names require denominator definitions to be compared.
4. Reverse-direction relative changes have different magnitudes
The relative increase from 20% to 25% is 25%. Returning from 25% to 20% divides −5 by the starting 25, giving −20%. Percentage-point changes are +5 and −5, but relative magnitudes differ.
| Hypothetical change | Percentage-point change | Relative change |
| 20% → 25% | +5 percentage points | +25% |
| 25% → 20% | −5 percentage points | -20% |
| 0.2% → 0.3% | +0.1 percentage points | +50% |
| 0% → 5% | +5 percentage points | Cannot calculate with this formula because the original is zero |
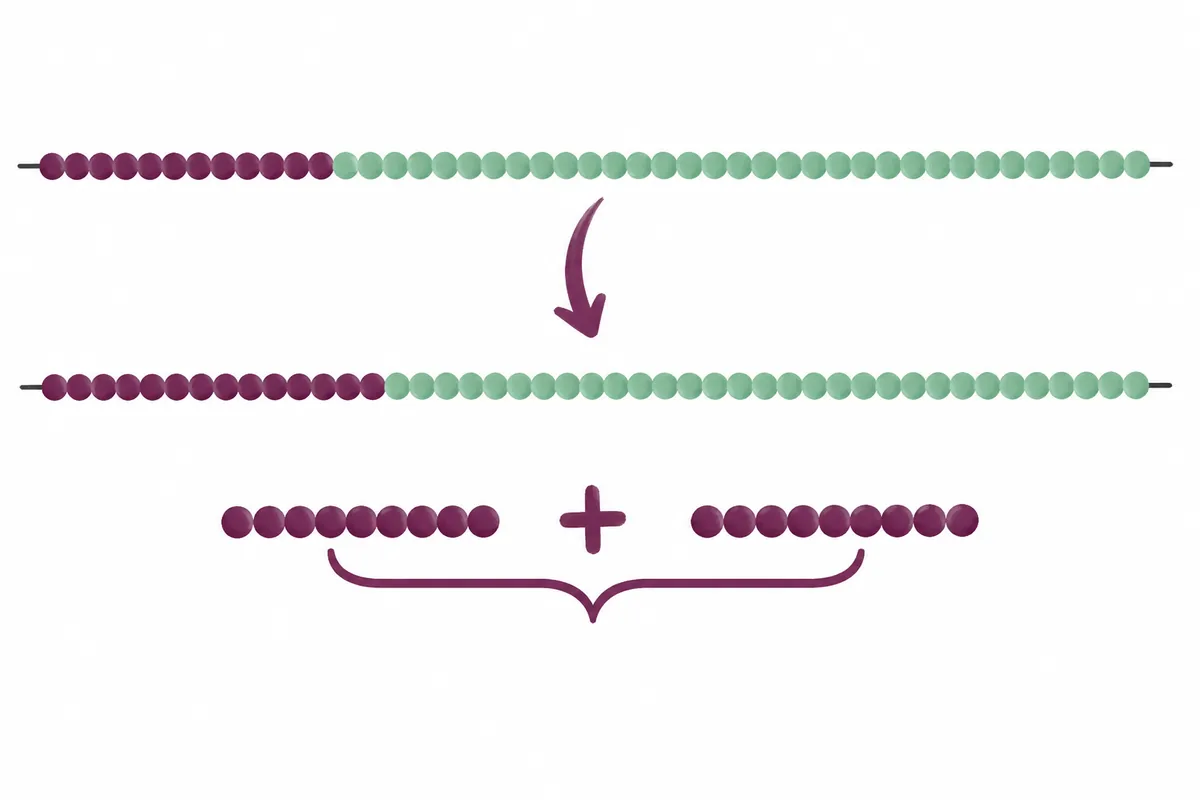
The original value is the relative-change denominator, so reversing direction changes the reference. Equal relative rises and falls need not return to the original. Distinguish adding differences in identical units from applying successive relative changes.
5. When the original value is zero or very small
From 0% to 5%, the difference is 5 percentage points, but the relative-change formula divides by zero. Instead of inventing “infinite increase,” state both rates and explain that relative change cannot be calculated by that formula.
Tiny starting values can make relative change look large. A hypothetical pass rate from 0.2% to 0.3% rises 50% relatively but only 0.1 percentage points. Provide both to convey actual scale, not the more sensational expression.
For small samples, read component counts too. This article calculates neither sampling error nor statistical significance, so rate differences alone do not establish effects. Correct ratio arithmetic and causal or certainty interpretation are separate stages needing more evidence.
6. Multiply successive relative increases
Suppose a value of 100 rises 3%, then another 4% relative to its new value. The result is 100×1.03×1.04=107.12, a 7.12% increase from the start. Changing bases makes it unequal to simply adding 3 and 4 for 7%.
By contrast, a rate moving from 20% to 23% then 27% rises 3 and 4 percentage points, totaling 7 points. A 3% relative increase differs from 3 percentage points. Check the base when news says “increased again.”
A 40% rate increasing by 10% becomes 40×1.10=44%. Increasing by 10 percentage points gives 50%. Different wording yields different results from the same start; translating statements into equations reveals ambiguity.
7. Differences when calculating from rounded values
Suppose original rates are 12.44% and 12.46%. At one decimal place they appear as 12.4% and 12.5%. Displayed difference is 0.1 percentage points, while the original difference is 0.02. Display and calculation precision can differ.
Prefer sufficiently precise original values for calculation and round only the final display. If only displayed numbers exist, state that they were used. Do not print many decimals as though greater precision exists without originals. Rounding particularly matters for small differences.
Consistent decimal places help within a table. ONS writing guidance also recommends consistency in percentage series. Matching decimal places does not improve underlying accuracy: writing 20.00% instead of 20% does not make measurement or aggregation more precise.
8. A checking sequence for articles and reports
First check indicator and denominator, then record original and new values. Decide whether you mean their difference or relative change. Use percentage points for differences and percent for relative changes, presenting count changes alongside them when needed.
Finally compare periods and populations, zero starting values, and rounding. If units were omitted while transcribing, return to the original. “Increase” alone does not establish magnitude or cause; read actual values and calculation bases.
For example: “The completion rate rose from 20% to 25%, a rise of 5 percentage points and a relative increase of 25%. Both periods covered 200 items.” Readers can compare the meanings. These are illustrative figures; actual results must identify their source and period.
The illustration compares two calculations of the same hypothetical change. It is not a trend graph of original data or an actual survey result. Distinguishing percent from percentage points lets readers understand change on a shared basis rather than choosing larger numbers.
Official sources and writing standards
- Eurostat: Glossary — Percentage point
- Office for National Statistics: Percentages and percentage points
References checked: 2026-10-06. This explanation was written with AI assistance based on official sources actually opened. Separately marked calculations, code, and checking examples are illustrative, not results from directly testing or measuring the user environment. Changes to features and official sources were rechecked during publication preparation.
Original illustrations created to help explain this article.
Original on Tistory ↗